The Render token is ranked #90 and is trading around $½ a billion market capitalization. The current market price of the token is $1.73USDT and it is up by 3.4% for the day as compared to BTC which is down by 1.6% for the day.
The RNDR/USDT chart has broken out of multi week consolidation with good volumes. It gained 84% last week and has been up by 33% this week. It is showing tremendous relative strength compared to the rest of the crypto markets. Outperformance is expected to continue in coming weeks.
MintingM Rating
Get deeper insights into the crypto market’s weekly trends discussed on ourSpotify podcast.
The sentiment towards the cryptocurrency market turns to GREED. Compared to last week, the Fear & Greed Index has changed from “50” to “61”.
SOPR
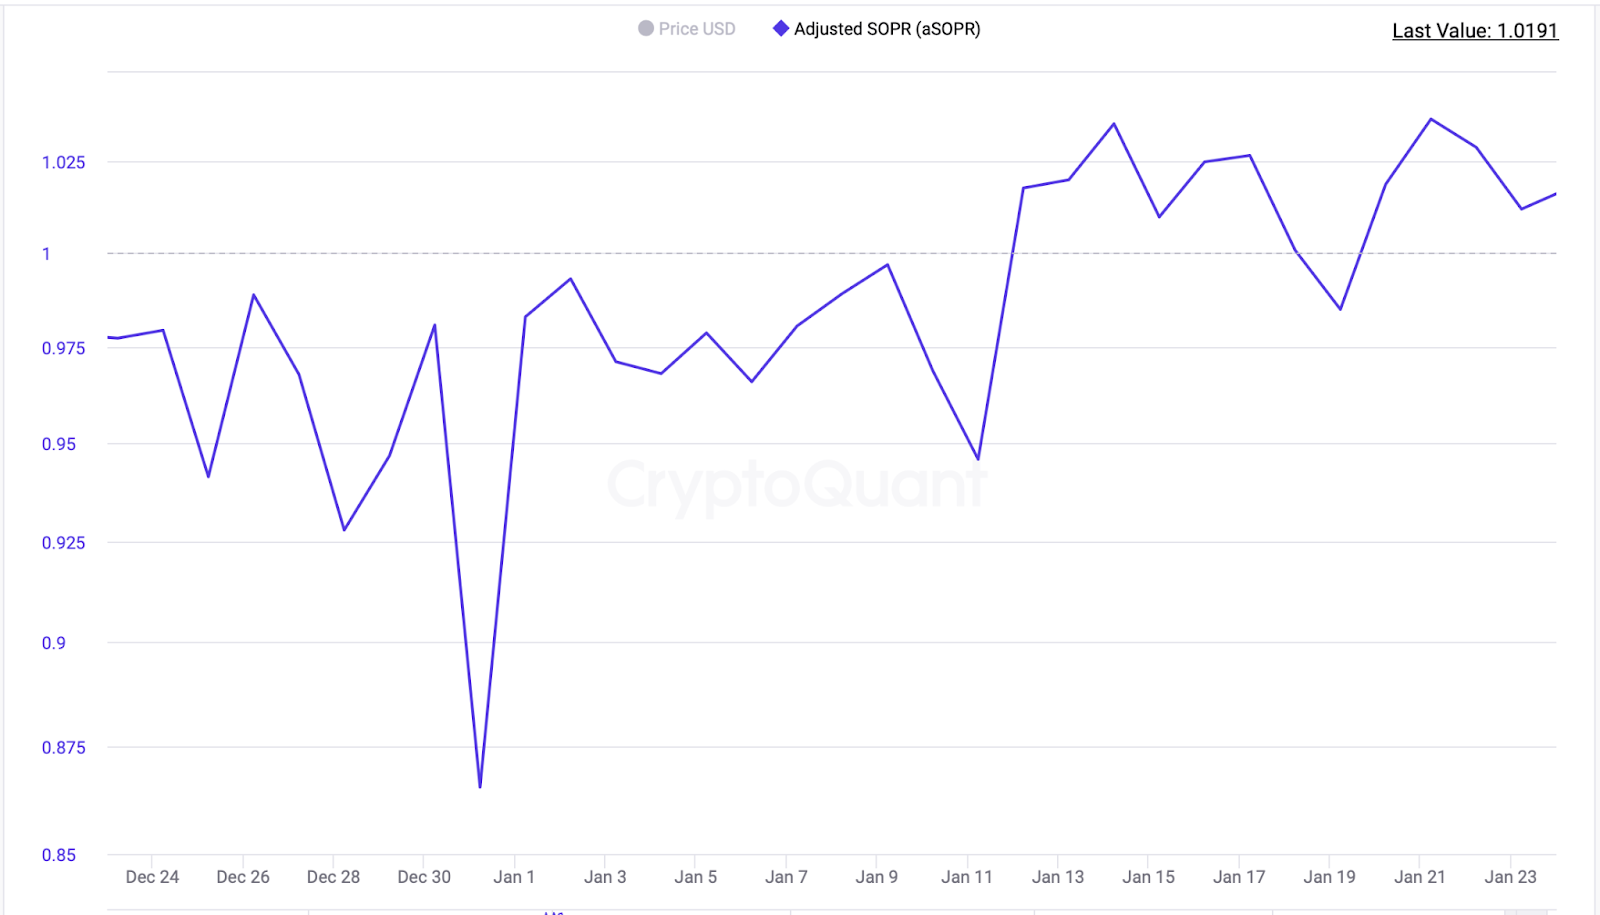
Another data to evaluate the sentiment of the general public would be to look at Spent Output Profit Ratio (SOPR). What is SOPR? In layman terms, it indicates if people have sold their BTC at a profit or if they sold at a loss. An SOPR value above 1 indicates that profit booking dominated loss booking and below 1 indicates that loss booking dominated profit booking. A value of 1 indicates that the coins were sold at their purchase price. Adjusted SOPR filters out transactions that are younger than 1 hour, thus, clearing out noise from the metric.
aSOPR for this week stands at 1 which means the coins were sold at their purchase price
Is This The End of the Bear Market?
CVDD-TERMINAL PRICE CHART INDICATOR
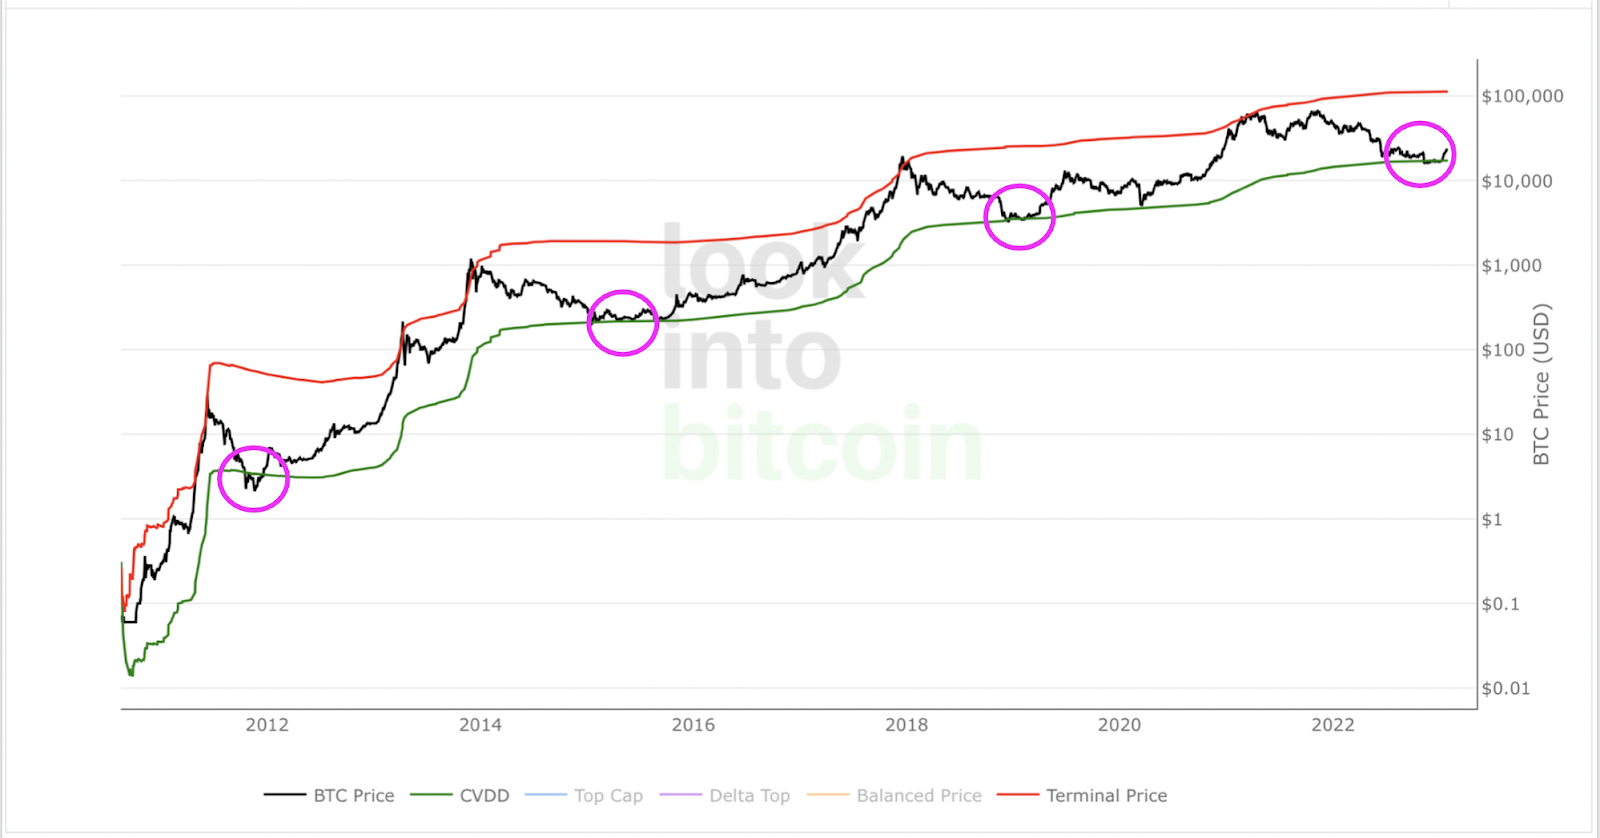
TERMINAL PRICE – This is an on-chain indicator. That means it uses data from the Bitcoin blockchain to identify actual user behavior and activity.Before Terminal price is calculated, it is first necessary to calculate Transferred Price. Transferred price takes the sum of Coin Days Destroyed and divides it by the existing supply of bitcoin and the time it has been in circulation. The value of Transferred Price is then multiplied by 21.This Terminal Price has historically been very effective at forecasting the tops of Bitcoin price cycles. Currently the TERMINAL PRICE stands at $112,687
CVDD – tracks the cumulative sum of this value-time destruction as coins move from old hands into new hands as a ratio of the market age. It is then multiplied by 6 million, which is a somewhat arbitrary number as it is not linked to any relevant Bitcoin data. The result is that it has historically correctly forecasted the major lows of Bitcoins price with good accuracy.
Currently the Bitcoin CVDD stands at $17,239 which acts as the long term support levels, Bitcoin Price bounced back from here as expected
MVRV Z-Score
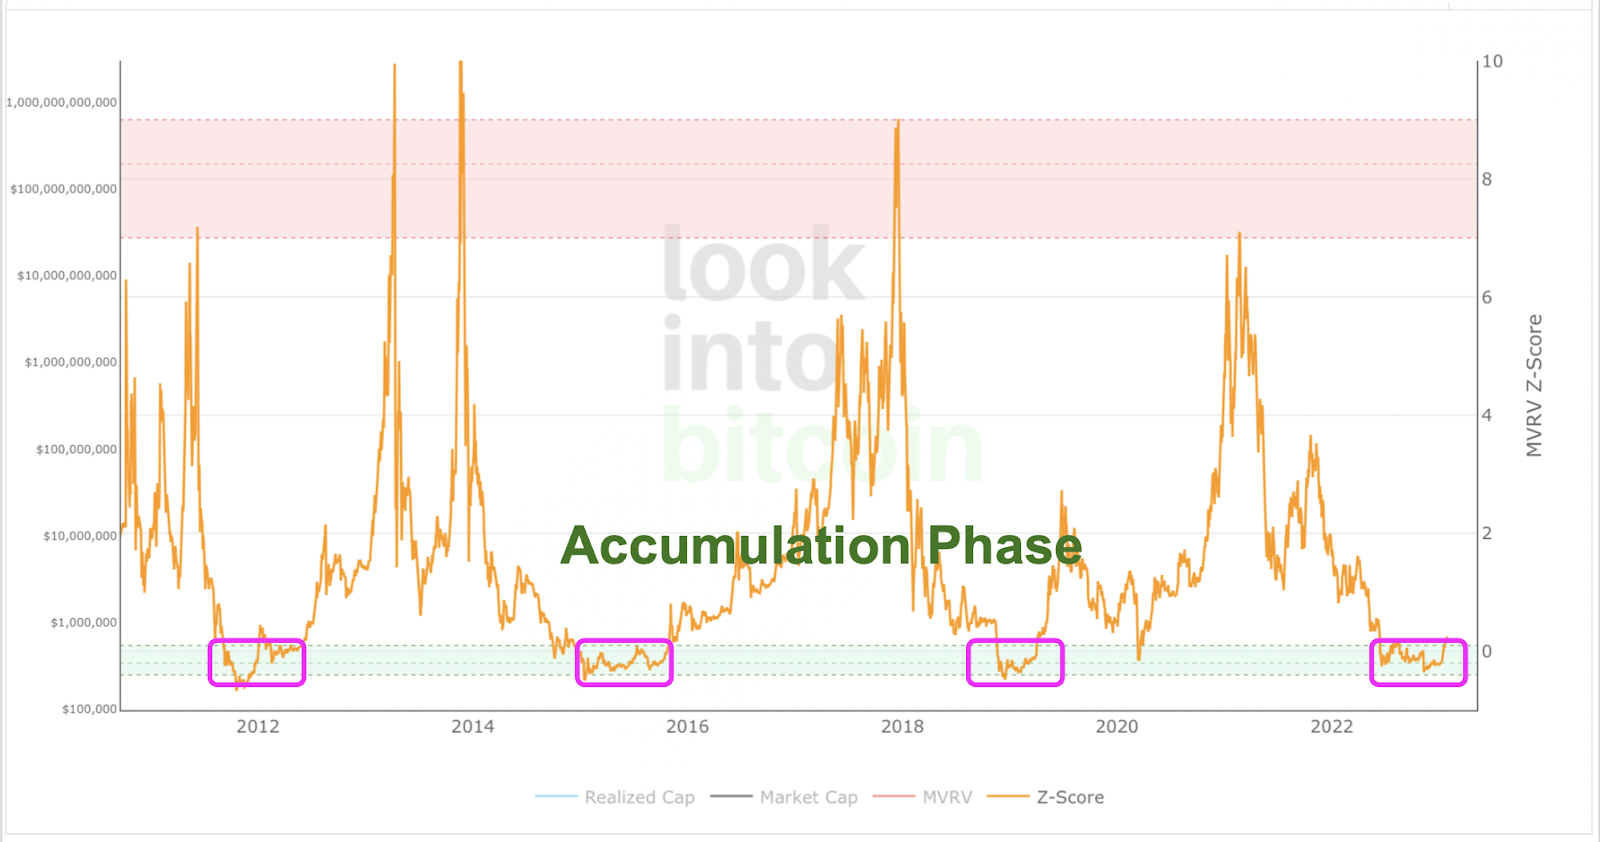
The MVRV Z-score has historically been very effective in identifying periods where market value is moving unusually high above realized value. These periods are highlighted by the z-score (red line) entering the pink box and indicating the top of market cycles. It has been able to pick the market high of each cycle within two weeks.
It also shows when market value is far below realized value, highlighted by z-score entering the green box. Buying Bitcoin during these periods has historically produced outsized returns.
Historically accumulation/bottom formation was seen when Z-Score entered the green zone.
Overall Market Performance
Dow Jones
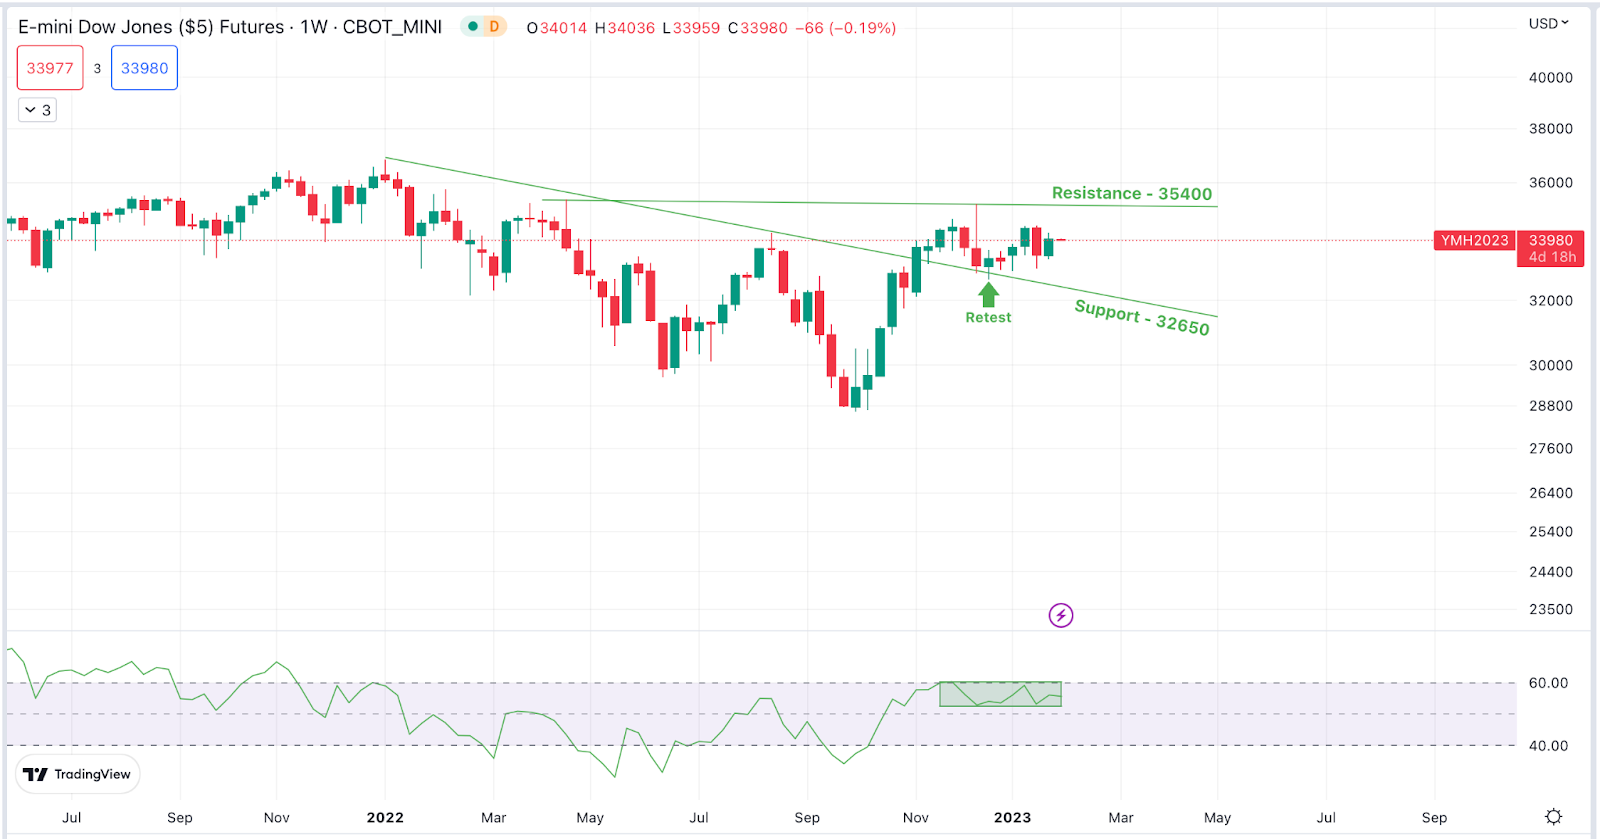
The Dow Jones Industrial Average gained by 1.71% in the last week. The next resistance is expected at 35,400 and immediate support is expected at 32,650 levels.
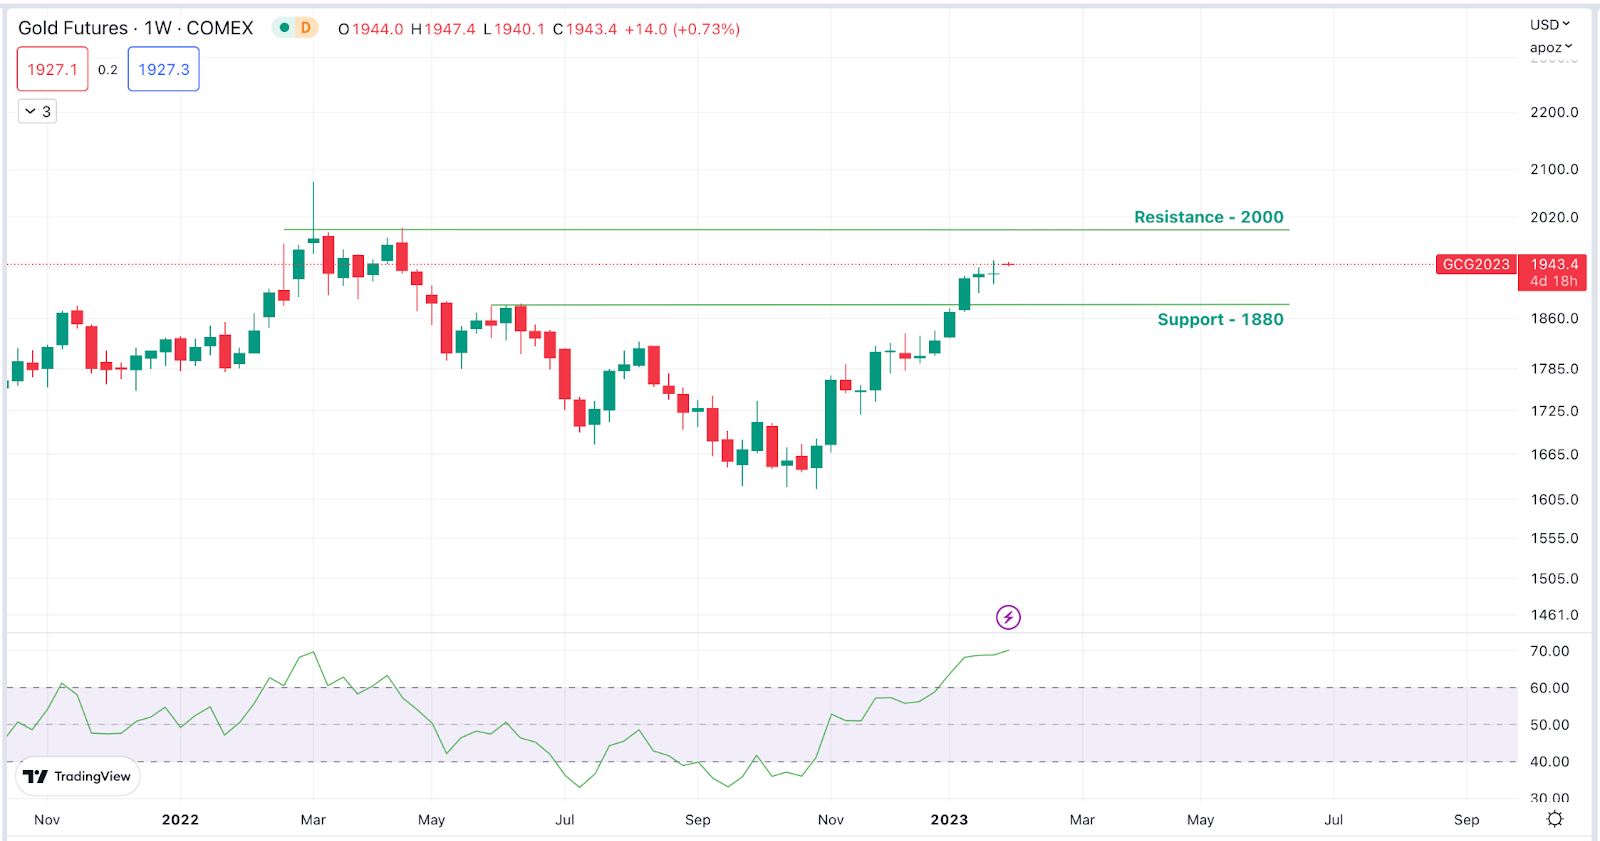
Gold
Gold Futures have formed Doji candles on a weekly time frame, sharp movement is expected. The next resistance is expected at $2,000 and immediate support is expected at $1,880
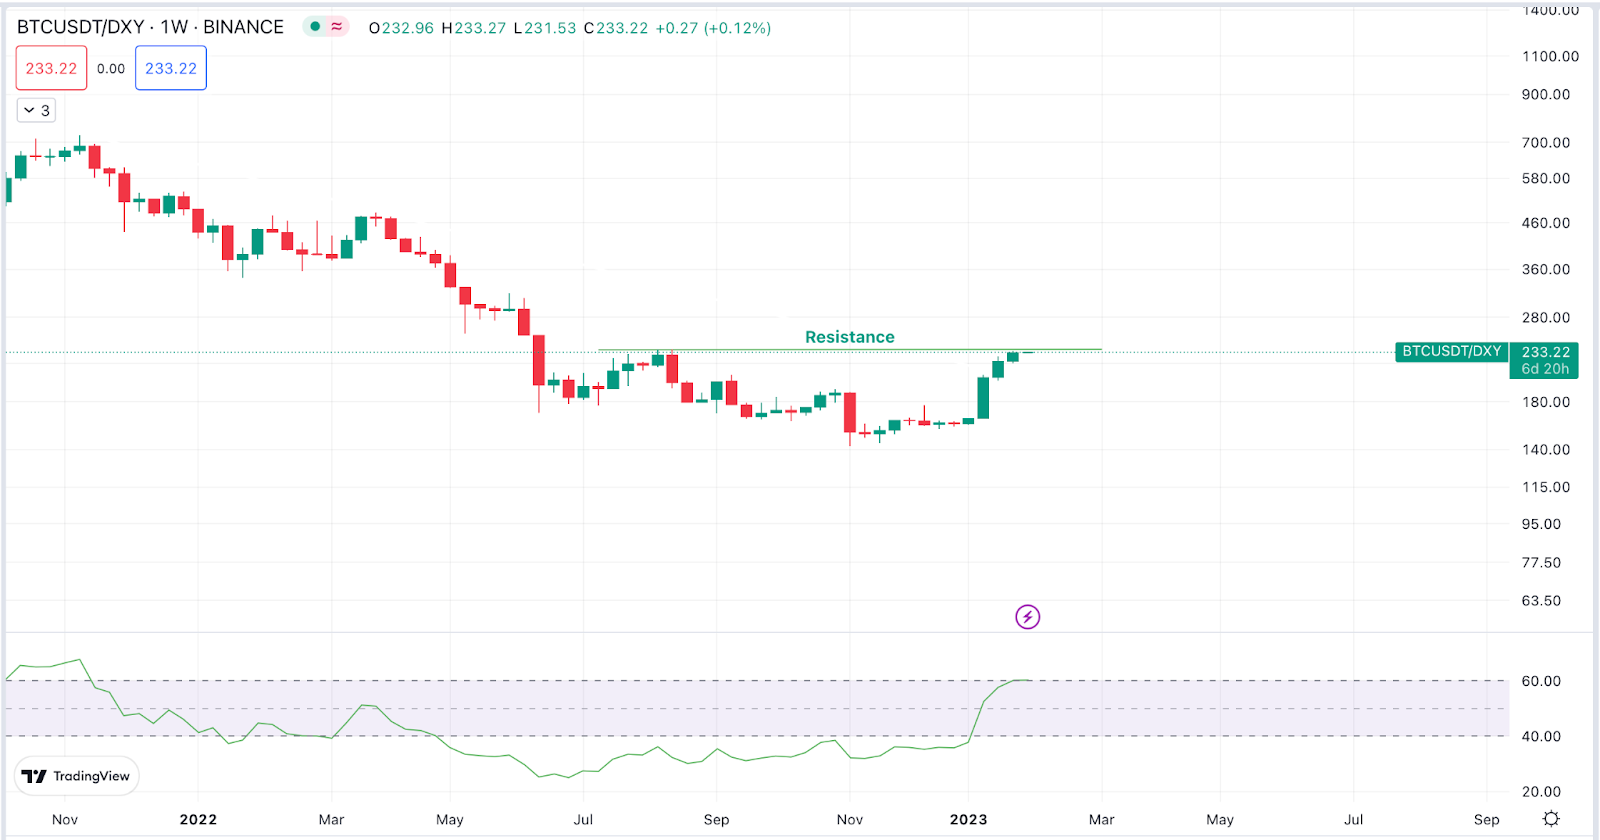
BTC/DXY
BTC/DXY has reached resistance and is expected to slow down. Bitcoin price support is expected at $21,500 and resistance is expected at $25,000
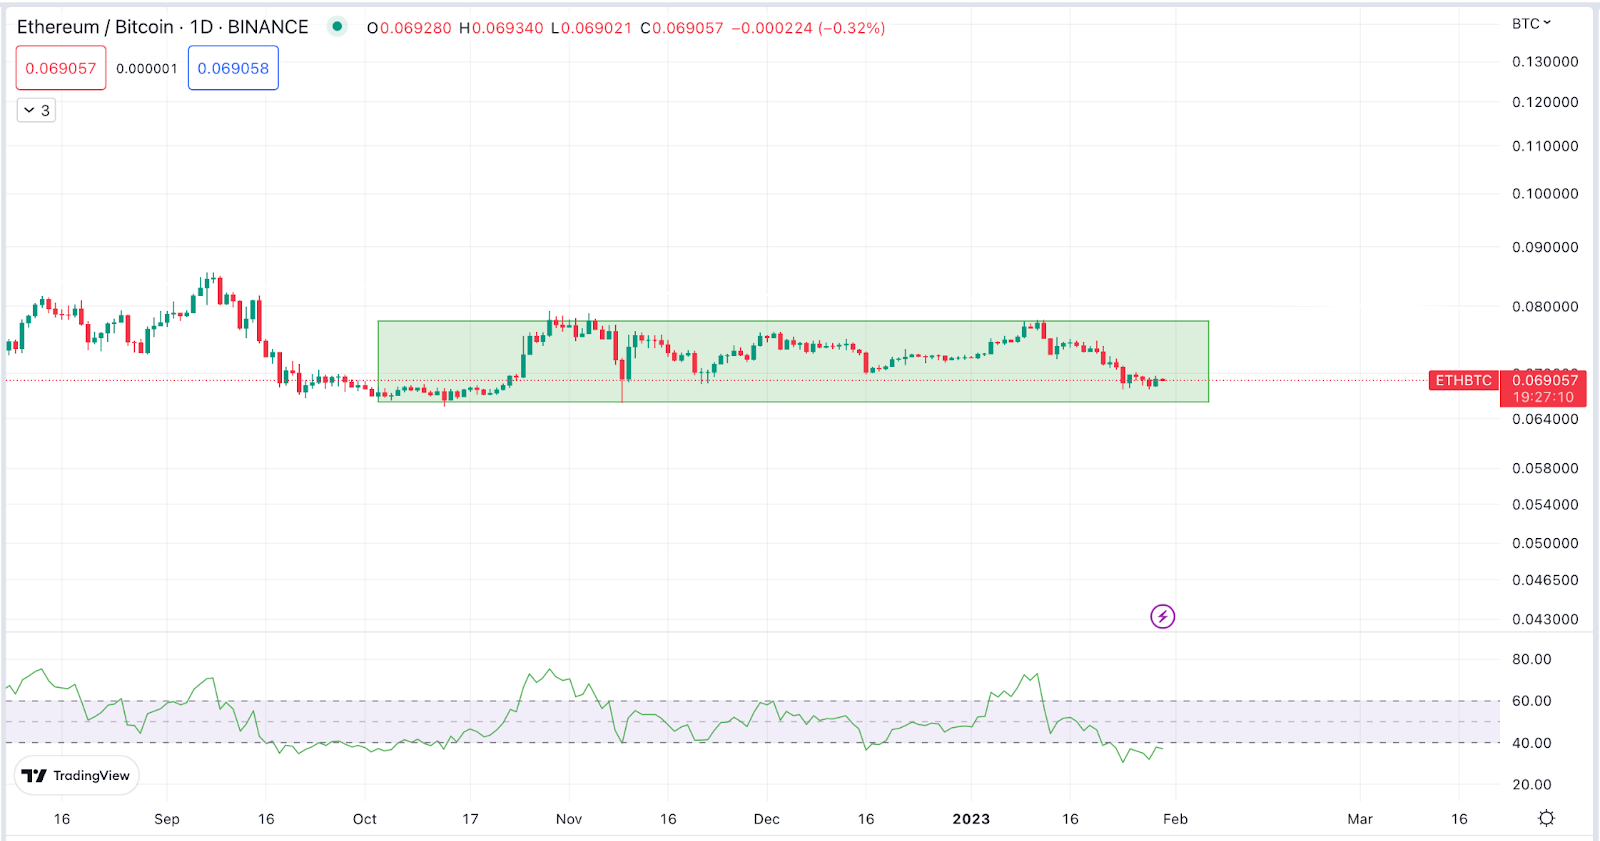
ETH/BTC
ETH/BTC is trading within the range. An immediate support is expected at 0.066 and the next resistance is expected at $0.077 levels.
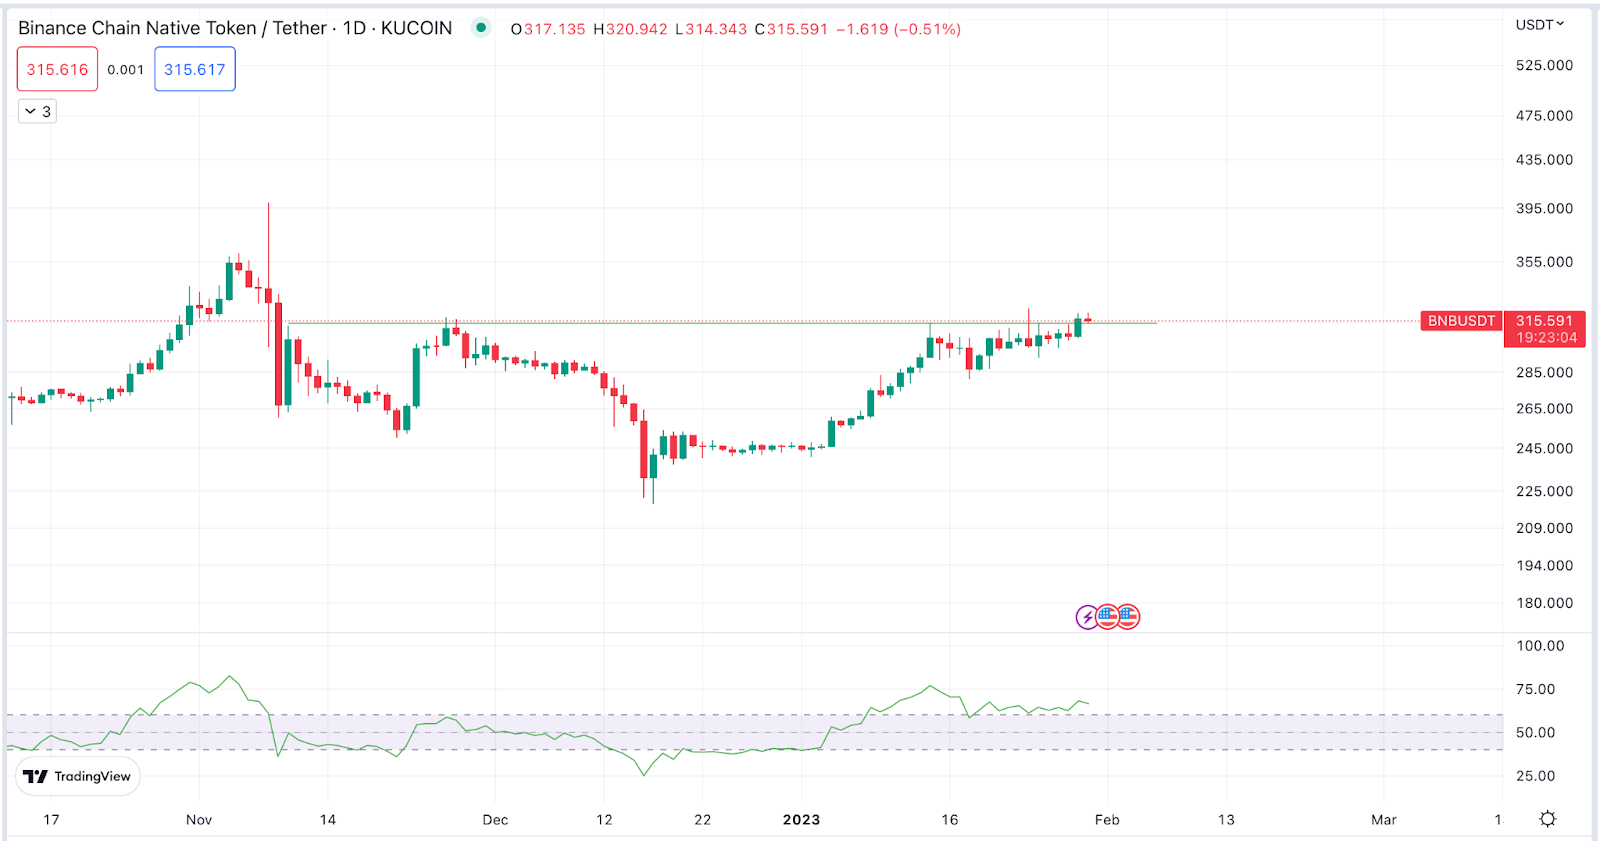
Pick of the Week – $BNB
Get deeper insights into the crypto market’s weekly trends discussed on ourSpotify podcast.
The sentiment towards the cryptocurrency market continues to remain in the Fear zone. Compared to last week’s, the Fear & Greed Index has changed marginally from “27” to “25”.
SOPR
Another data to evaluate the sentiment of the general public would be to look at Spent Output Profit Ratio (SOPR). What is SOPR? In layman terms, it indicates if people have sold their BTC at a profit or if they sold at a loss. An SOPR value above 1 indicates that profit booking dominated loss booking and below 1 indicates that loss booking dominated profit booking. A value of 1 indicates that the coins were sold at their purchase price. Adjusted SOPR filters out transactions that are younger than 1 hour, thus, clearing out noise from the metric.
aSOPR for this week stands at 0.98 which means the coins were sold at their purchase price
Is This The End of the Bear Market?
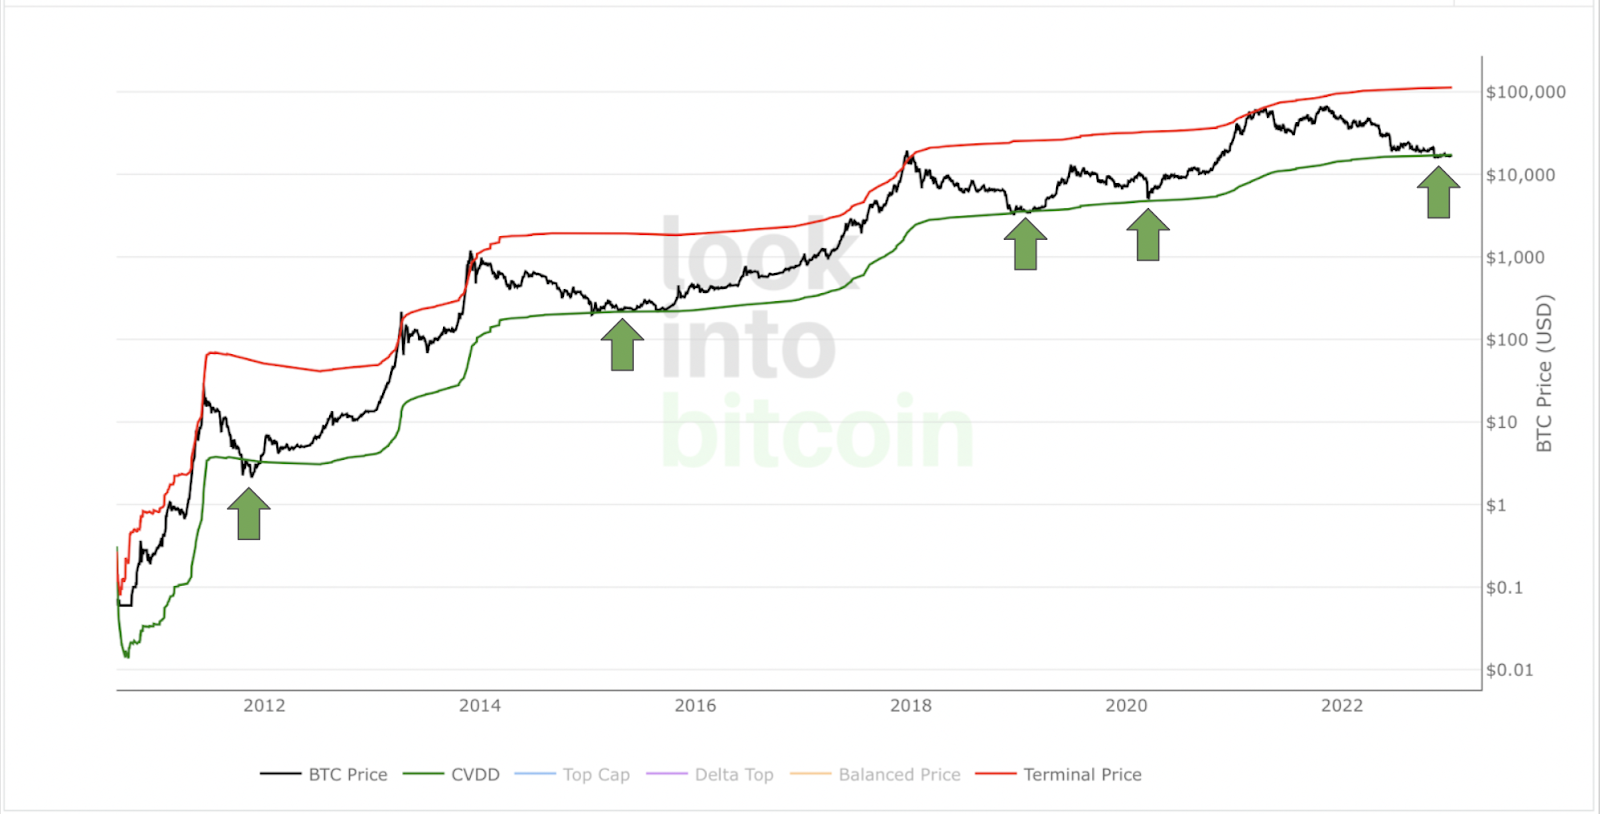
CVDD-TERMINAL PRICE CHART INDICATOR
TERMINAL PRICE – This is an on-chain indicator. That means it uses data from the Bitcoin blockchain to identify actual user behavior and activity.
Before Terminal price is calculated, it is first necessary to calculate Transferred Price. Transferred price takes the sum of Coin Days Destroyed and divides it by the existing supply of bitcoin and the time it has been in circulation. The value of Transferred Price is then multiplied by 21.
This Terminal Price has historically been very effective at forecasting the tops of Bitcoin price cycles. Currently the TERMINAL PRICE stands at $112,422
CVDD – tracks the cumulative sum of this value-time destruction as coins move from old hands into new hands as a ratio of the market age. It is then multiplied by 6 million, which is a somewhat arbitrary number as it is not linked to any relevant Bitcoin data.
The result is that it has historically correctly forecasted the major lows of Bitcoins price with good accuracy. Currently the Bitcoin CVDD stands at $17,180 which is the long term support levels, Bitcoin Price is expected to bounce back from here
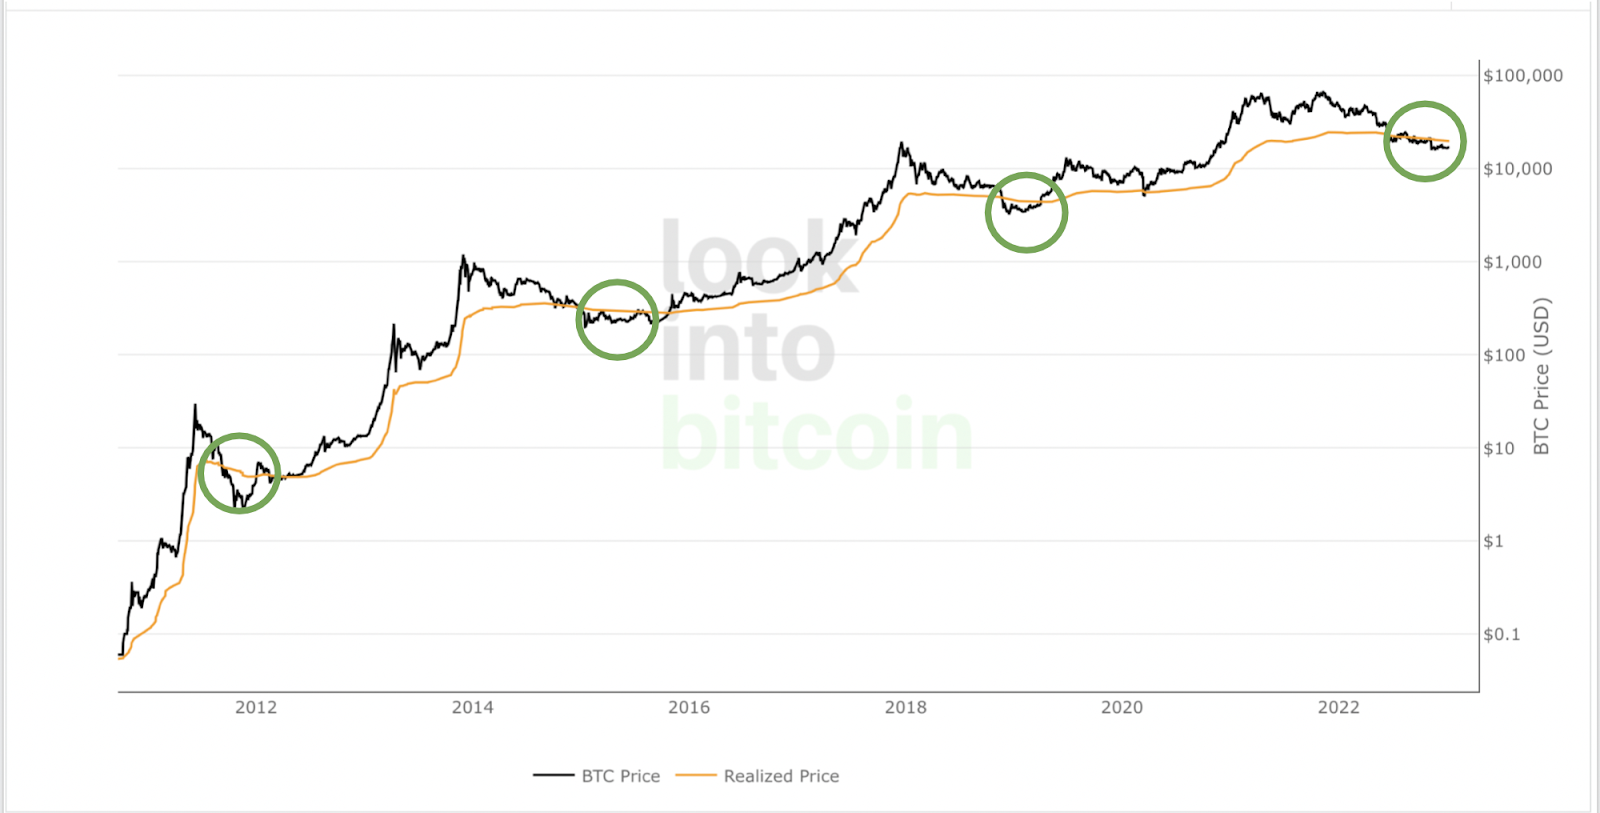
REALIZED PRICE
Realized price is defined as the average cost of acquisition based on every coin moved on-chain. In all the previous bear markets we see that the price trades below the realized price which indicates on average the coins held during this period have higher cost of acquisition than the current market price. Realized prices act as psychological support areas during bear markets.
How Is Realized Price Useful For Bitcoin Investors?
It is a useful metric because it can show when the market is under a period of distress. That is when the current Market Price drops below Realized Price, meaning that on aggregate Bitcoin holders are holding onto paper losses.
Historically, these periods have occurred at major cycle lows. This can be seen on the free Bitcoin live chart above.
The reason why this phenomenon happens is that many participants are not comfortable holding onto a losing position, fearing that their losses may increase. Particularly in a bear market when news and media about Bitcoin are very negative. They end up selling to value investors at the market cycle lows before $BTC Market Price eventually moves back up above Realized Price as it enters a bull market phase. This has historically held true as Bitcoin has continued to move through its adoption cycle.
The current price of Bitcoin is trading below the realized price of Bitcoin of 19,771 USD. For bull market confirmation, the market price of Bitcoin should be above realized price.
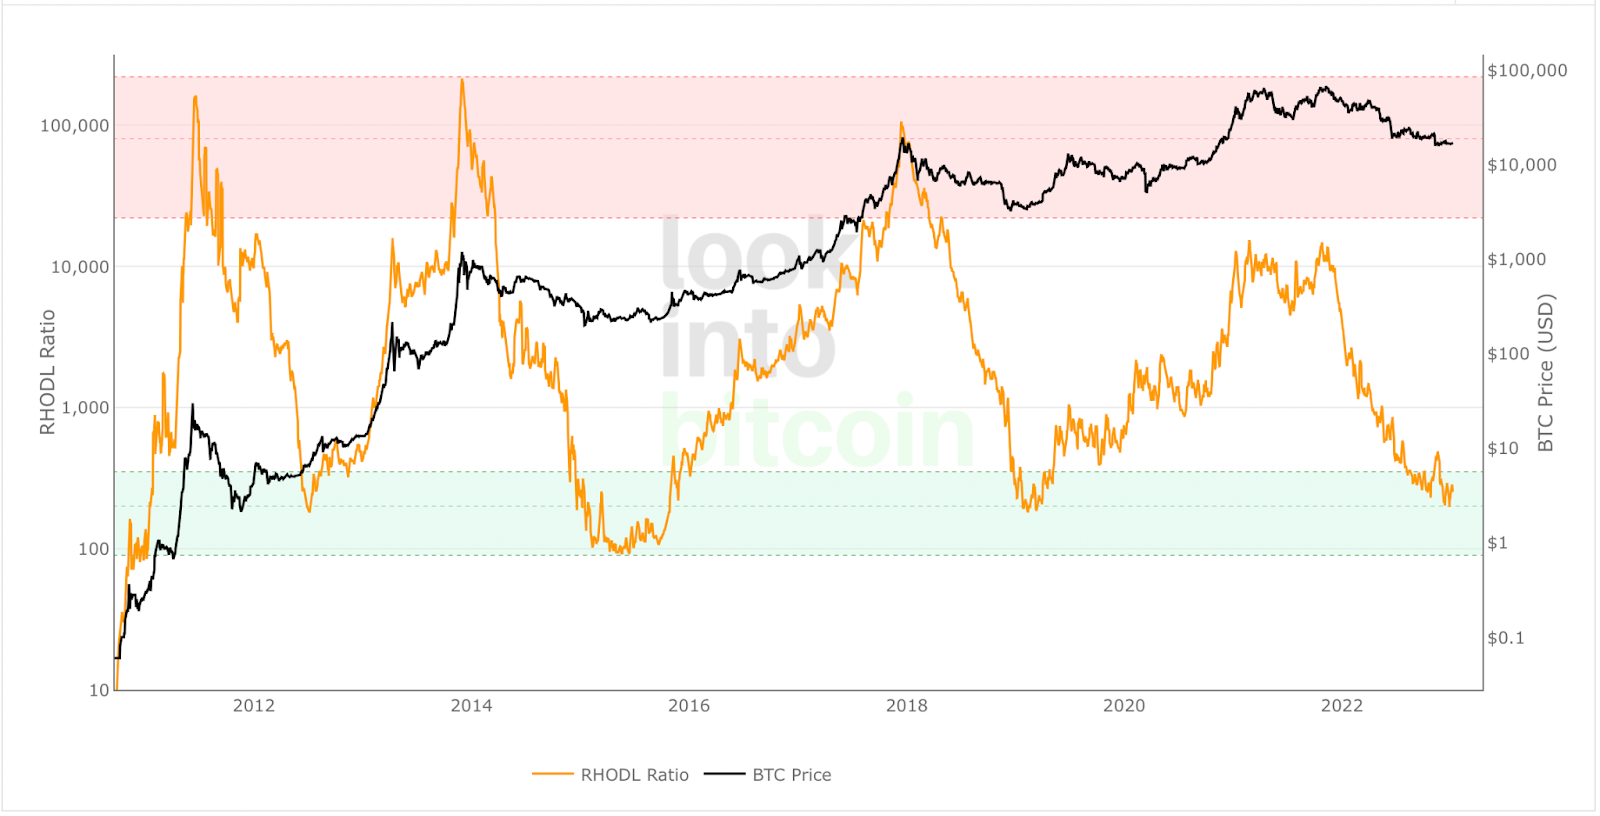
RHODL RATIO
RHODL Ratio is useful for identifying when Bitcoin price is running at the extremes of market conditions. It is able to forecast where Bitcoin price ($BTC) may need to pull back when the RHODL Ratio line approaches the upper red band, and also when $BTC price may rally after spending time in the lower green band.
Overall Market Performance
Dow Jones
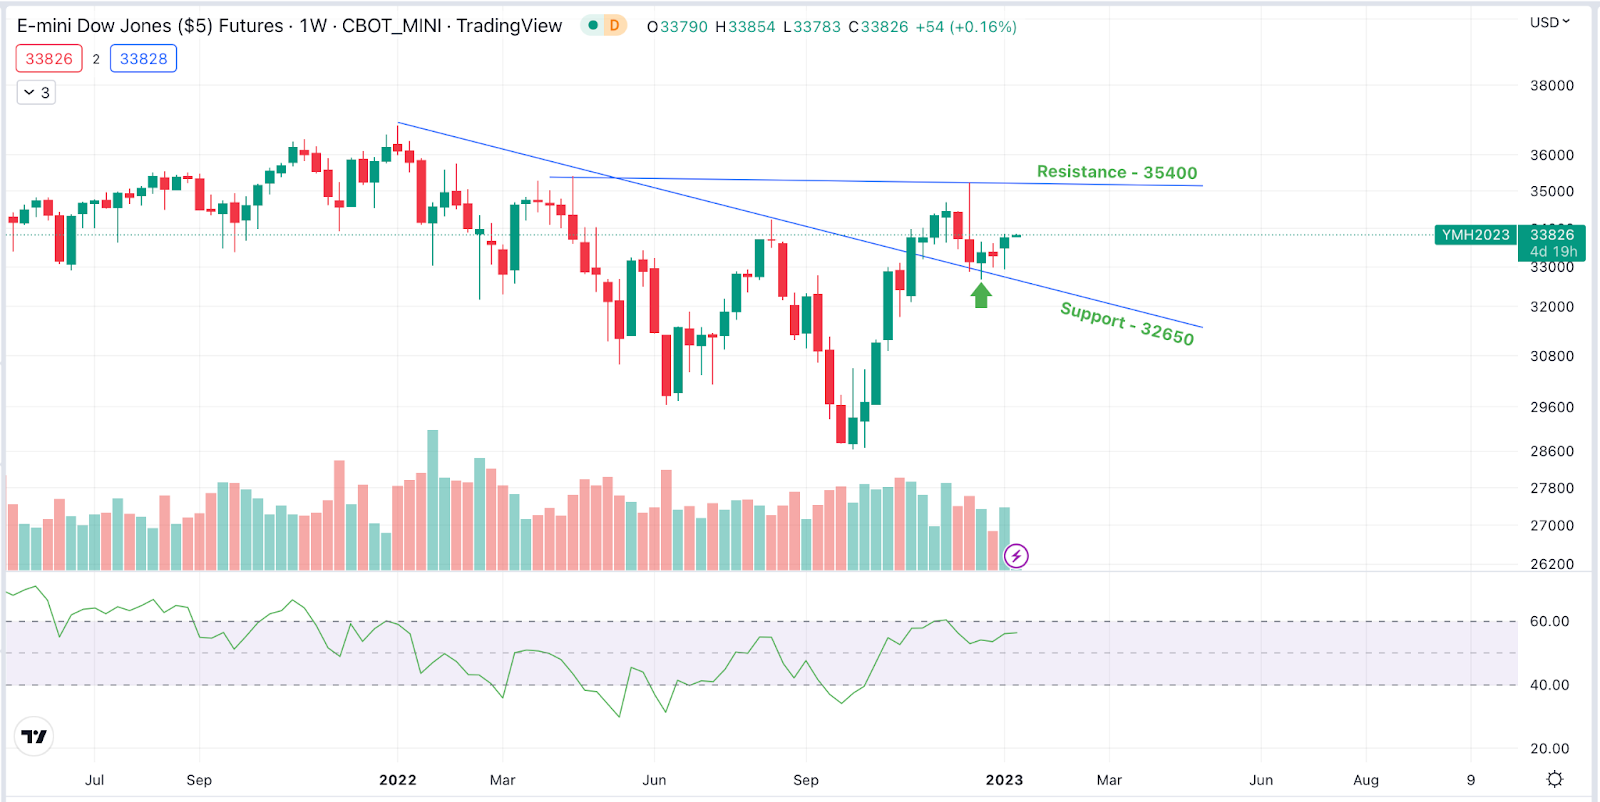
The Dow Jones Industrial Average gained by 1.46% in the last week. The next resistance is expected at 35,400 and immediate support is expected at 32,650 levels.
Gold
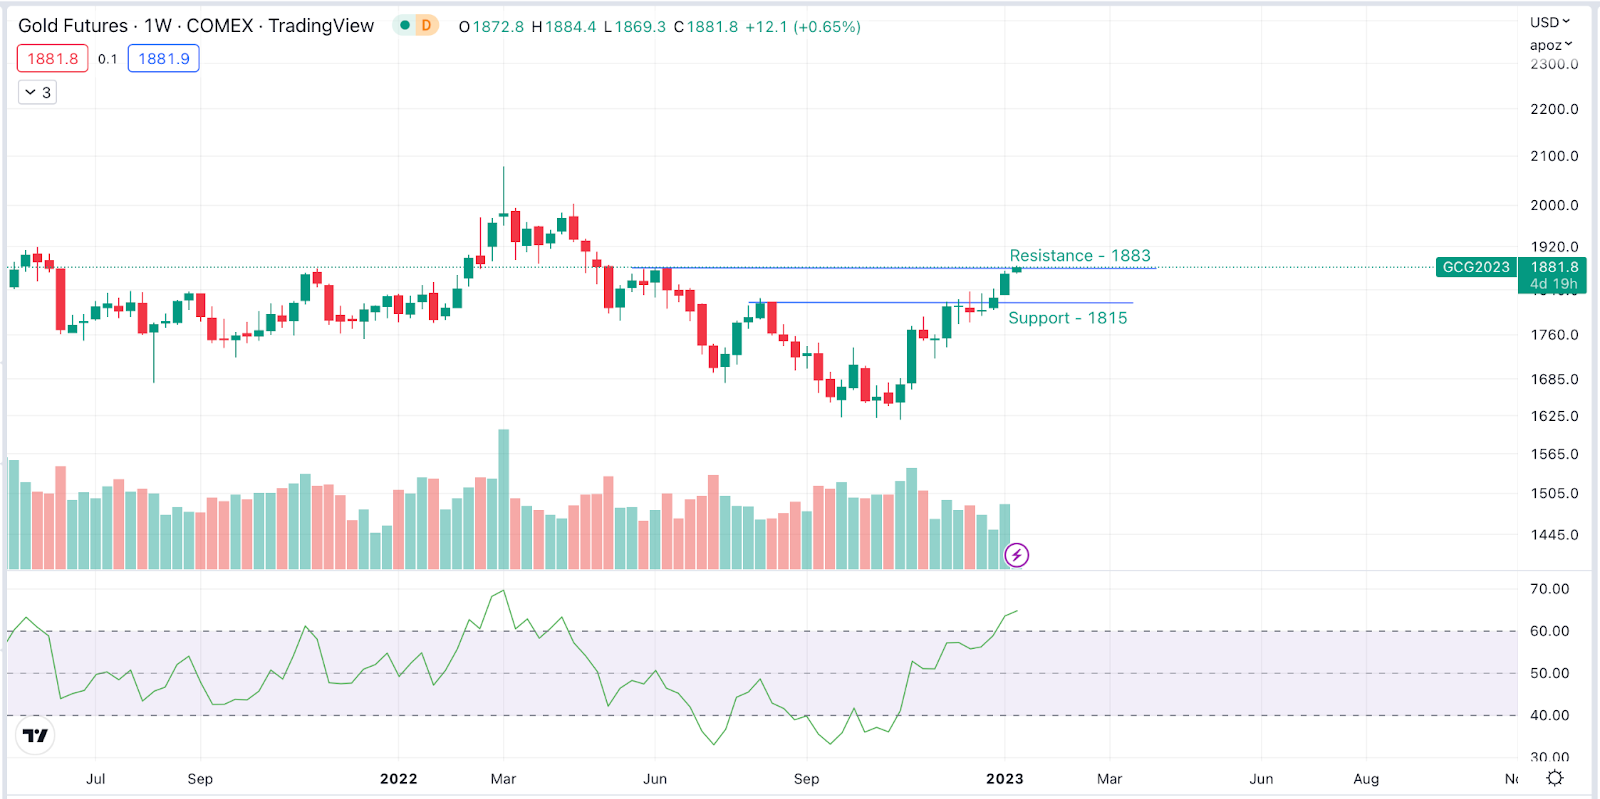
Gold Futures formed Inverted head and shoulder pattern, upside movement is expected. The next resistance is expected at $1,883 and immediate support is expected at $1,815
Bitcoin
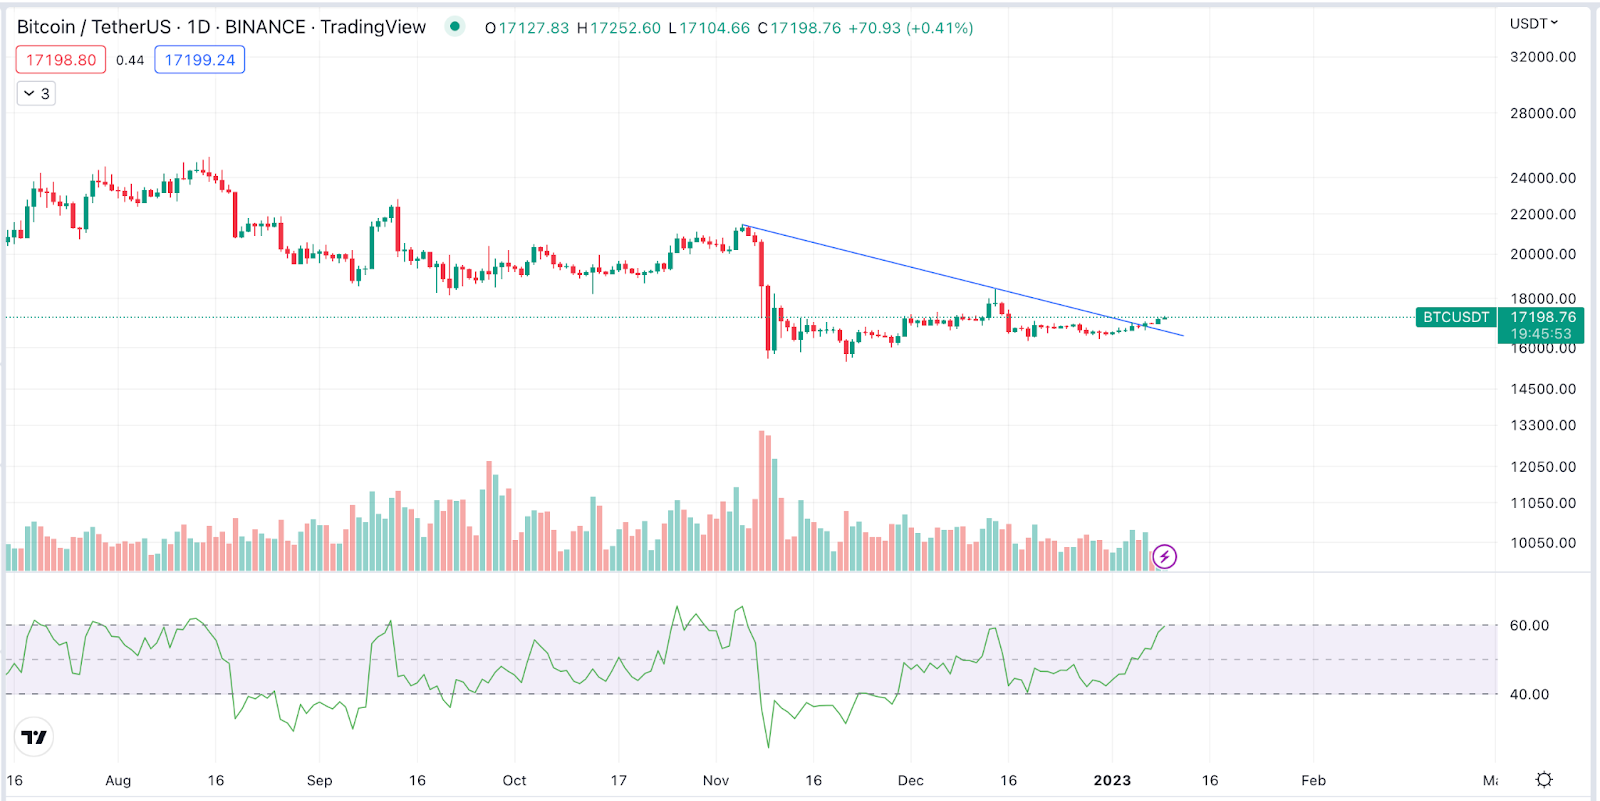
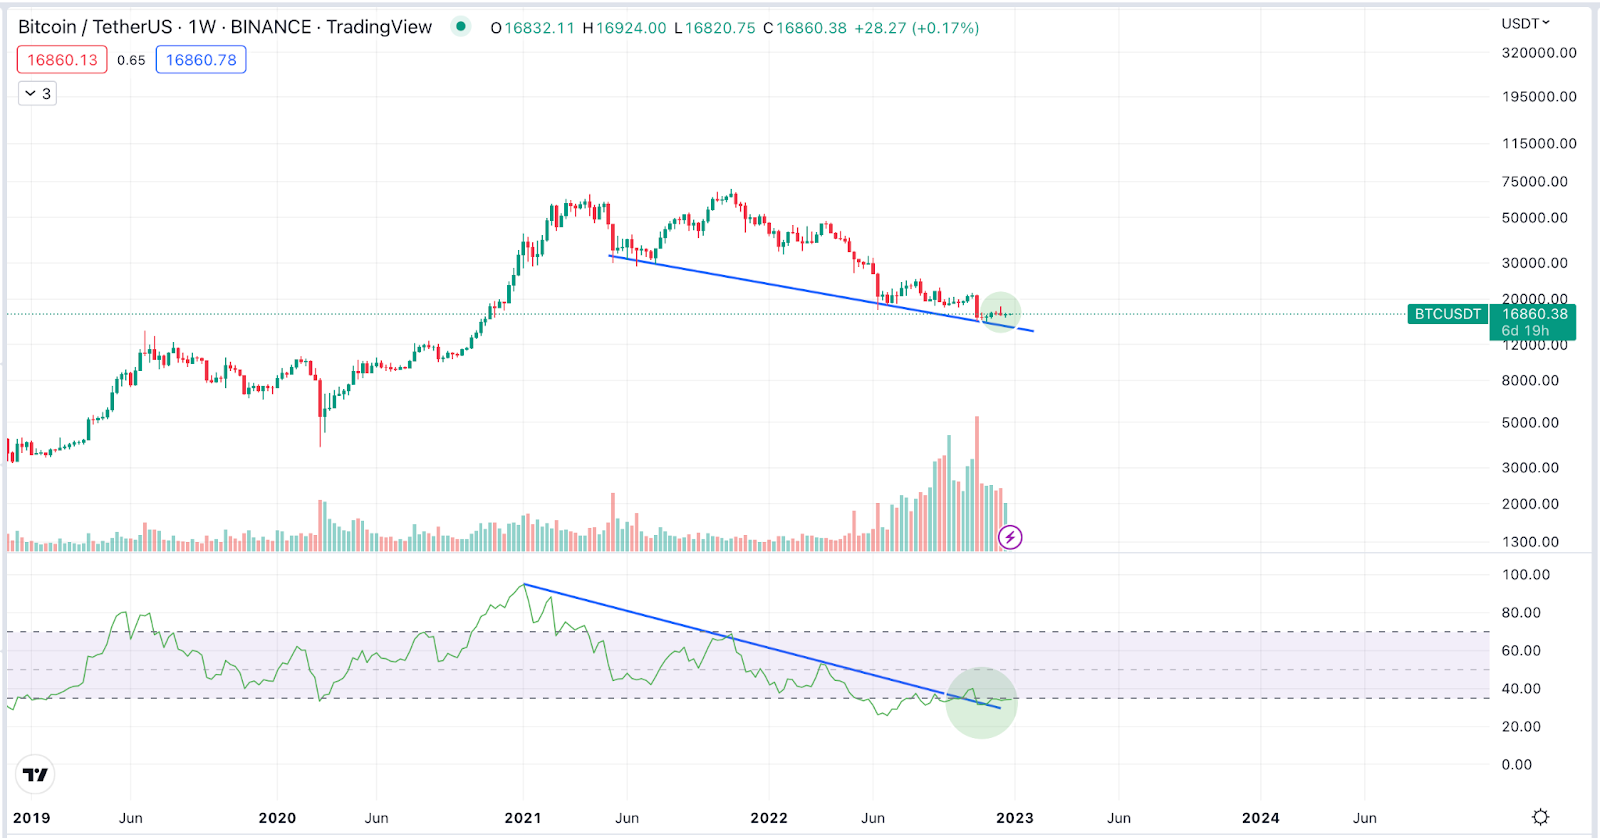
Bitcoin has broken the descending trendline, upside movement is expected for the week. The next resistance is expected at $18,388 and support at $16,450
ETHEREUM
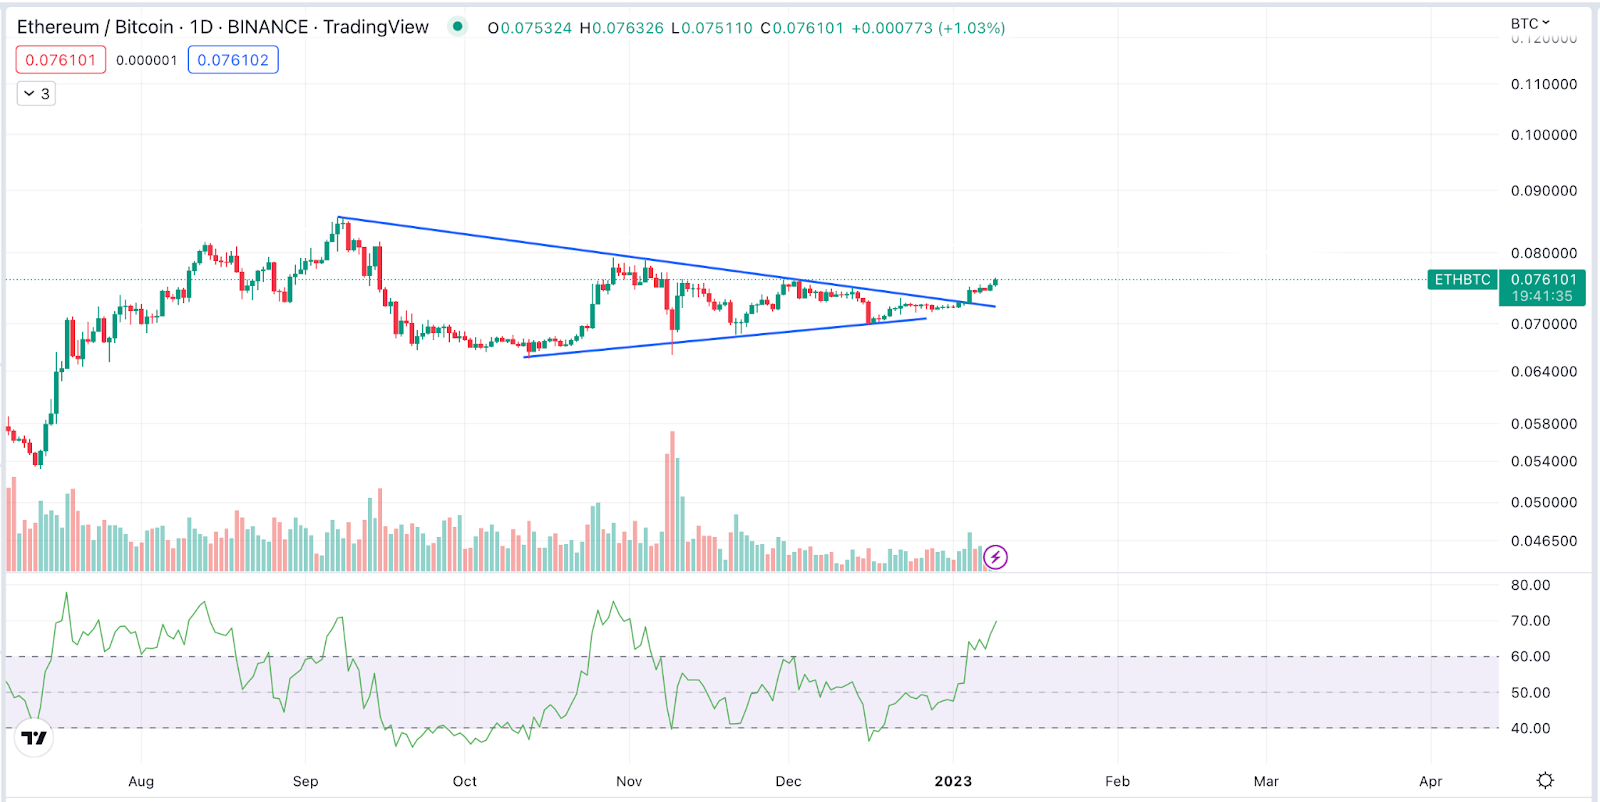
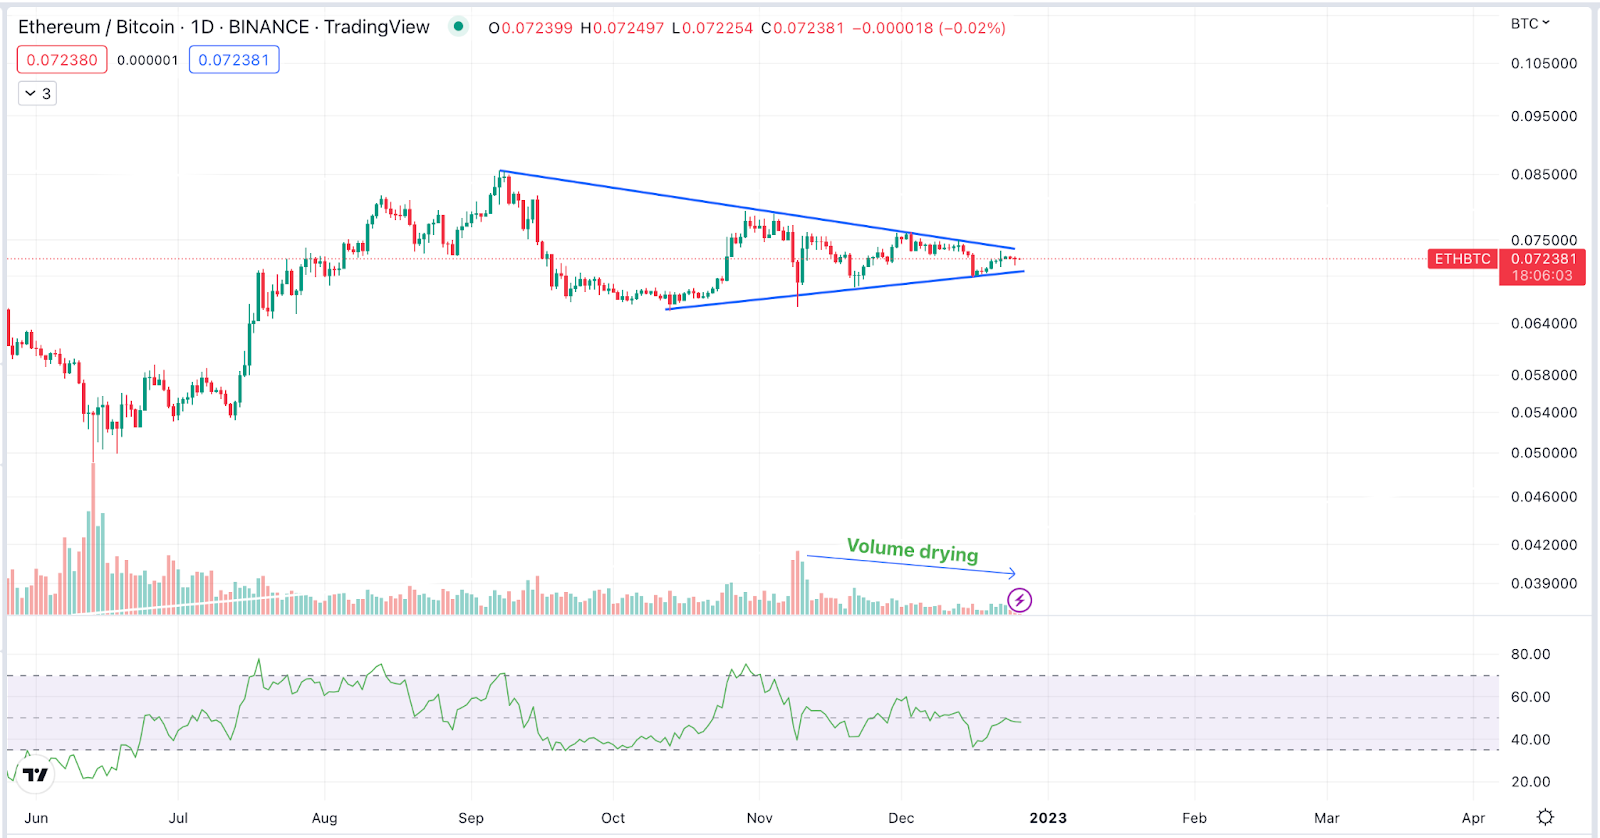
ETH/BTC broke out of the 3 month triangle pattern consolidation, upside movement is expected this week. An immediate support is expected at 0.071 and the next resistance is expected at 0.080 levels.
Get deeper insights into the crypto market’s weekly trends discussed on ourSpotify podcast.
Start your Crypto Investments with XMINT Bots today.
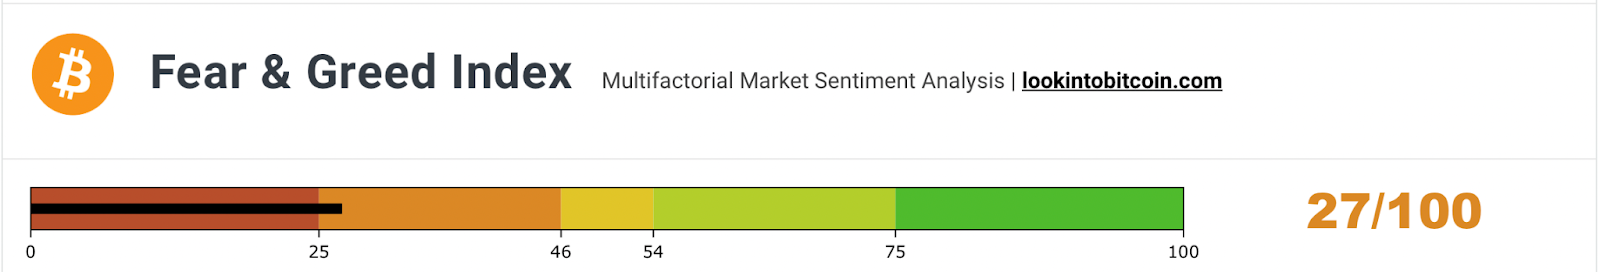
The sentiment towards the cryptocurrency market continues to remain in the Fear zone. Compared to last week’s, the Fear & Greed Index has changed marginally from “28” to “27”.
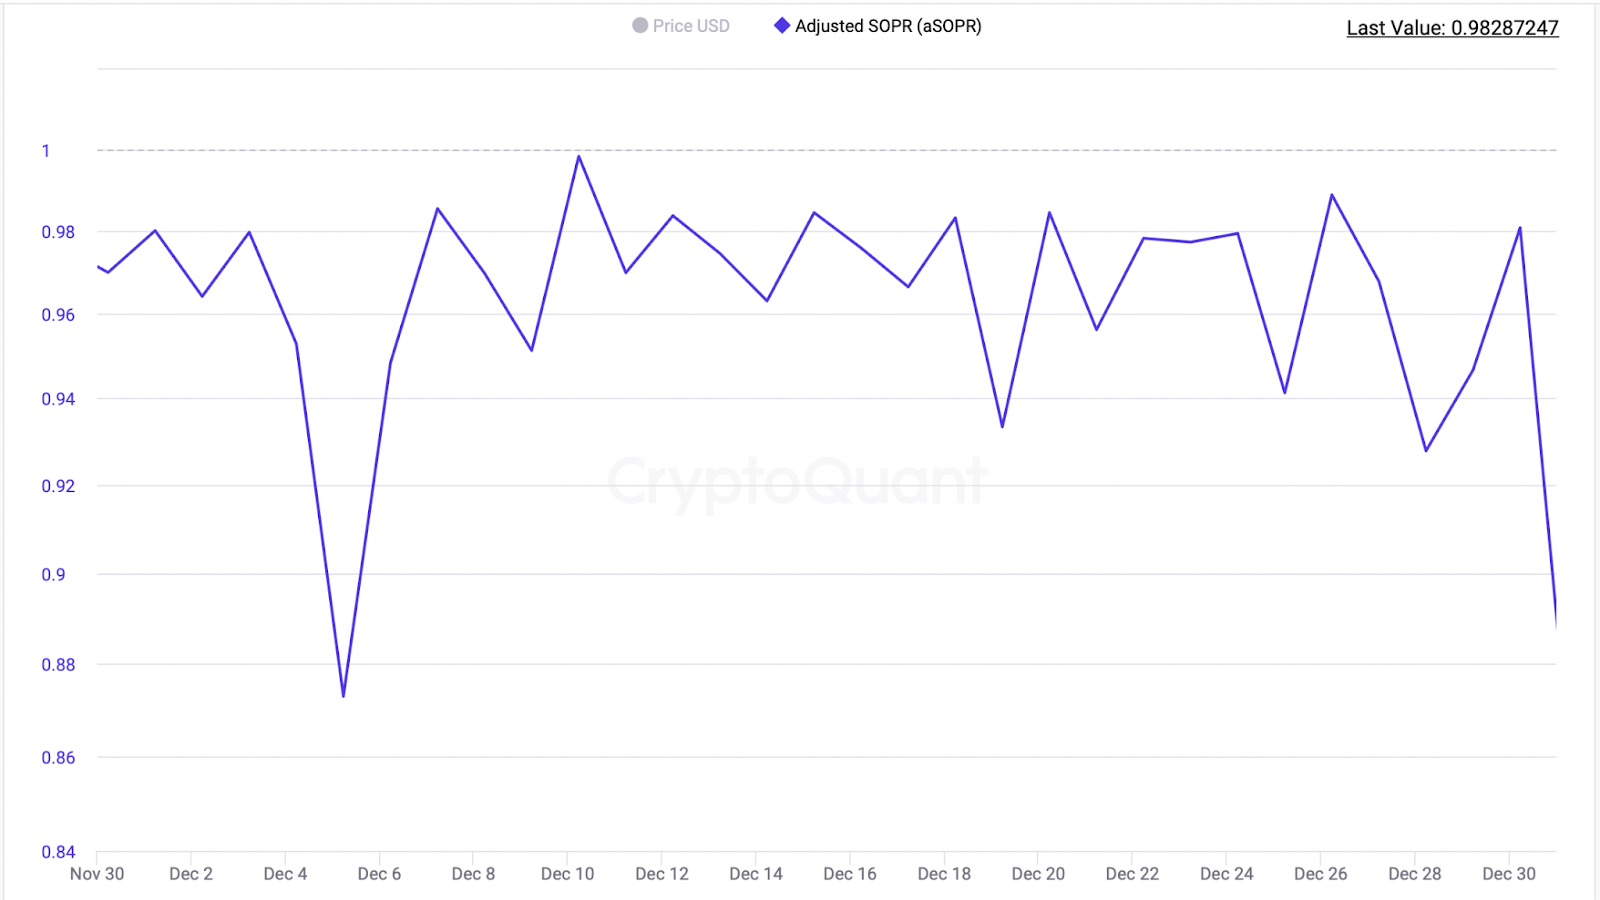
SOPR
Another data to evaluate the sentiment of the general public would be to look at Spent Output Profit Ratio (SOPR). What is SOPR? In layman terms, it indicates if people have sold their BTC at a profit or if they sold at a loss. An SOPR value above 1 indicates that profit booking dominated loss booking and below 1 indicates that loss booking dominated profit booking. A value of 1 indicates that the coins were sold at their purchase price. Adjusted SOPR filters out transactions that are younger than 1 hour, thus, clearing out noise from the metric.
aSOPR for this week stands at 0.98 which means the coins were sold at their purchase price
Is This The End of the Bear Market?
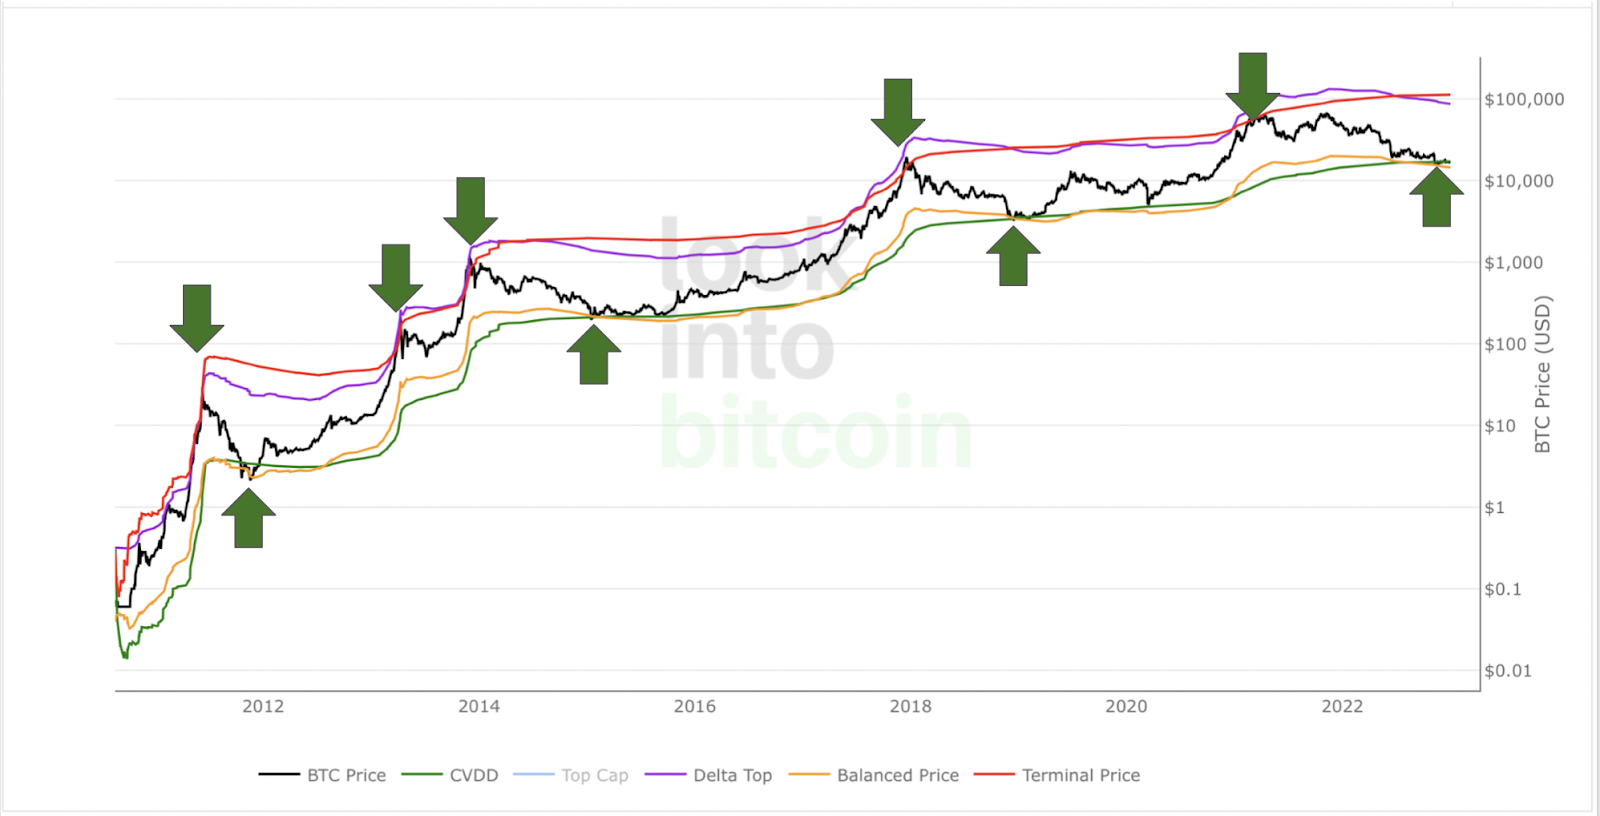
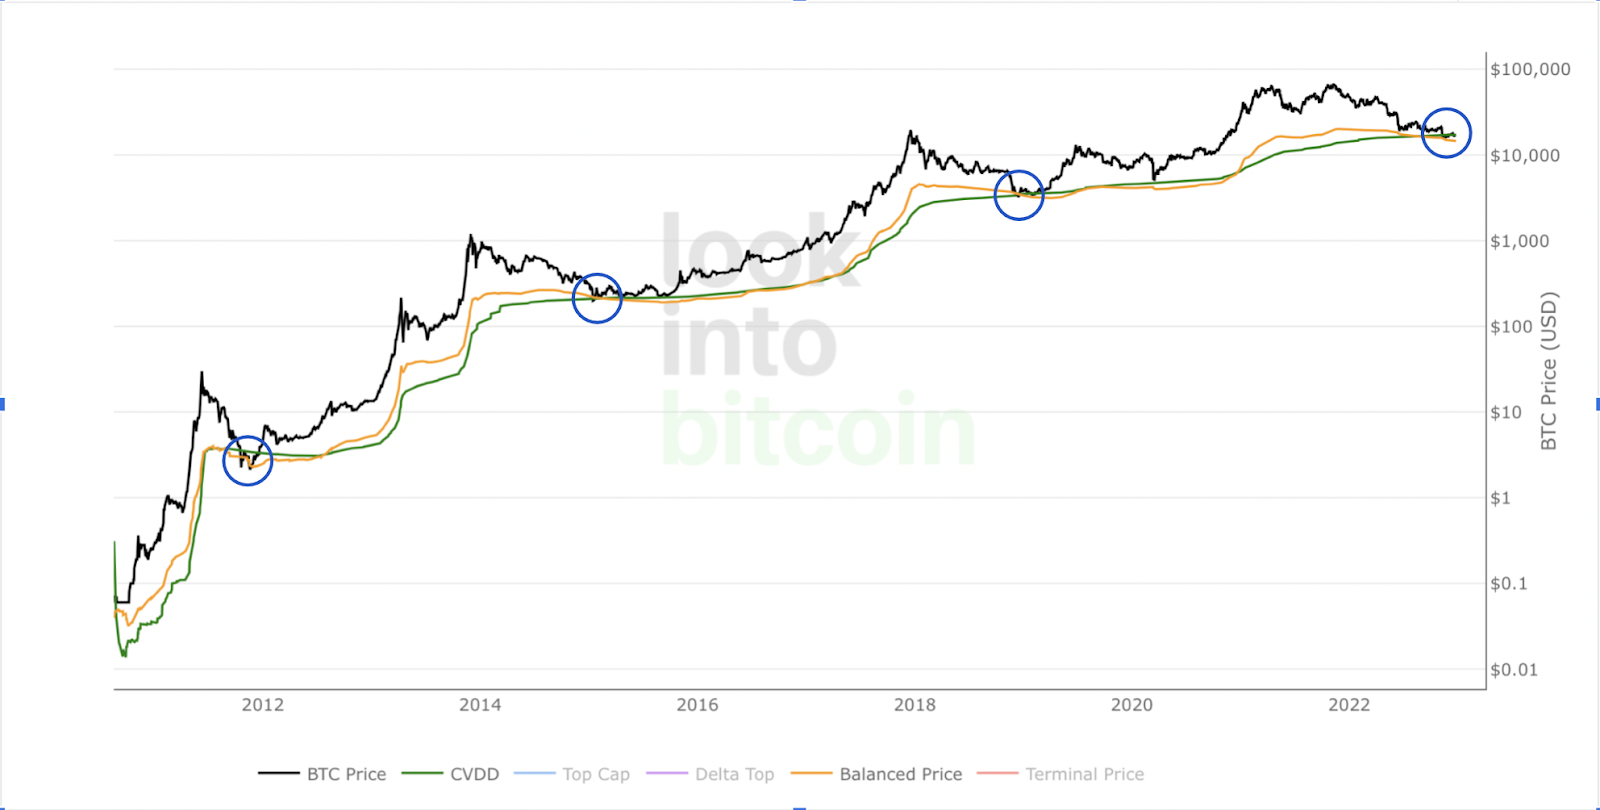
CVDD-BALANCED PRICE CHART INDICATOR
CVDD – tracks the cumulative sum of this value-time destruction as coins move from old hands into new hands as a ratio of the market age. It is then multiplied by 6 million, which is a somewhat arbitrary number as it is not linked to any relevant Bitcoin data.
The result is that it has historically correctly forecasted the major lows of Bitcoins price with good accuracy. Currently the CVDD stands at $17,160
BALANCED PRICE – This is an on-chain indicator used for Bitcoin price prediction at the bear market lows. This means that it is trying to identify the lowest price that Bitcoin may drop to in the future.
It is calculated by subtracting Transferred Price from Realized Price. Currently the BALANCED PRICE stands at $14,436
Balanced price has crossed below CVDD and Bitcoin price is trading below the cross. Historically the bottom formation was seen in such situations.
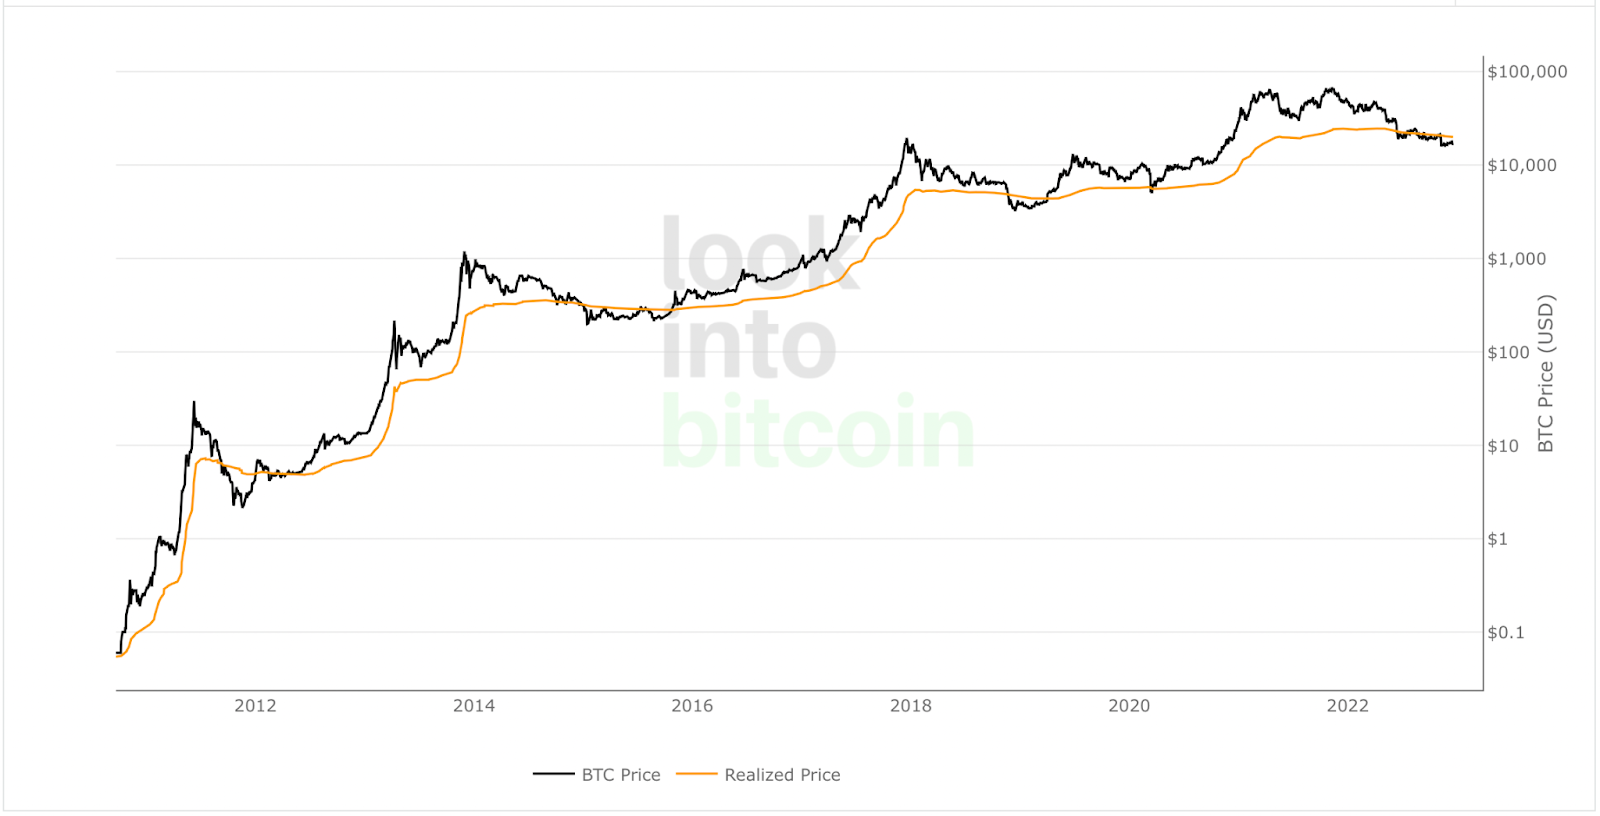
REALIZED PRICE
Realized price is defined as the average cost of acquisition based on every coin moved on-chain. In all the previous bear markets we see that the price trades below the realized price which indicates on average the coins held during this period have higher cost of acquisition than the current market price. Realized prices act as psychological support areas during bear markets.
How Is Realized Price Useful For Bitcoin Investors?
It is a useful metric because it can show when the market is under a period of distress. That is when the current Market Price drops below Realized Price, meaning that on aggregate Bitcoin holders are holding onto paper losses.
Historically, these periods have occurred at major cycle lows. This can be seen on the free Bitcoin live chart above.
The reason why this phenomenon happens is that many participants are not comfortable holding onto a losing position, fearing that their losses may increase. Particularly in a bear market when news and media about Bitcoin are very negative. They end up selling to value investors at the market cycle lows before $BTC Market Price eventually moves back up above Realized Price as it enters a bull market phase. This has historically held true as Bitcoin has continued to move through its adoption cycle.
The current price of Bitcoin is trading below the realized price of Bitcoin of 19,785 USD. For bull market confirmation, the market price of Bitcoin should be above realized price.
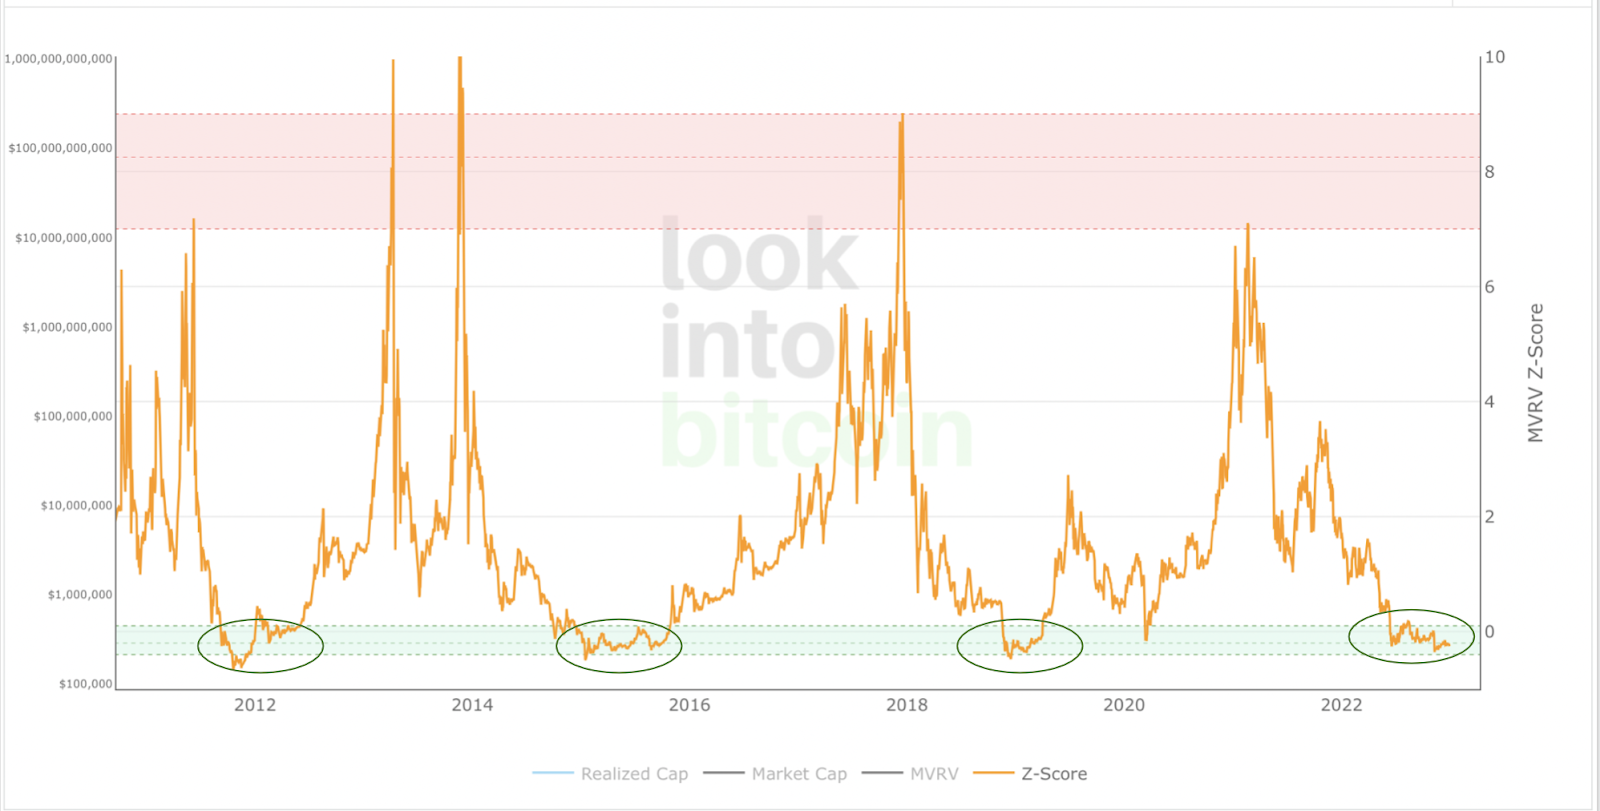
MVRV Z-SCORE
The MVRV Z-score has historically been very effective in identifying periods where market value is moving unusually high above realized value. These periods are highlighted by the z-score (red line) entering the pink box and indicating the top of market cycles. It has been able to pick the market high of each cycle within two weeks.
It also shows when market value is far below realized value, highlighted by z-score entering the green box. It is the accumulation phase and can last anywhere between 2 to 4 quarters, Buying Bitcoin during these periods has historically produced outsized returns.
Overall Market Performance
Dow Jones
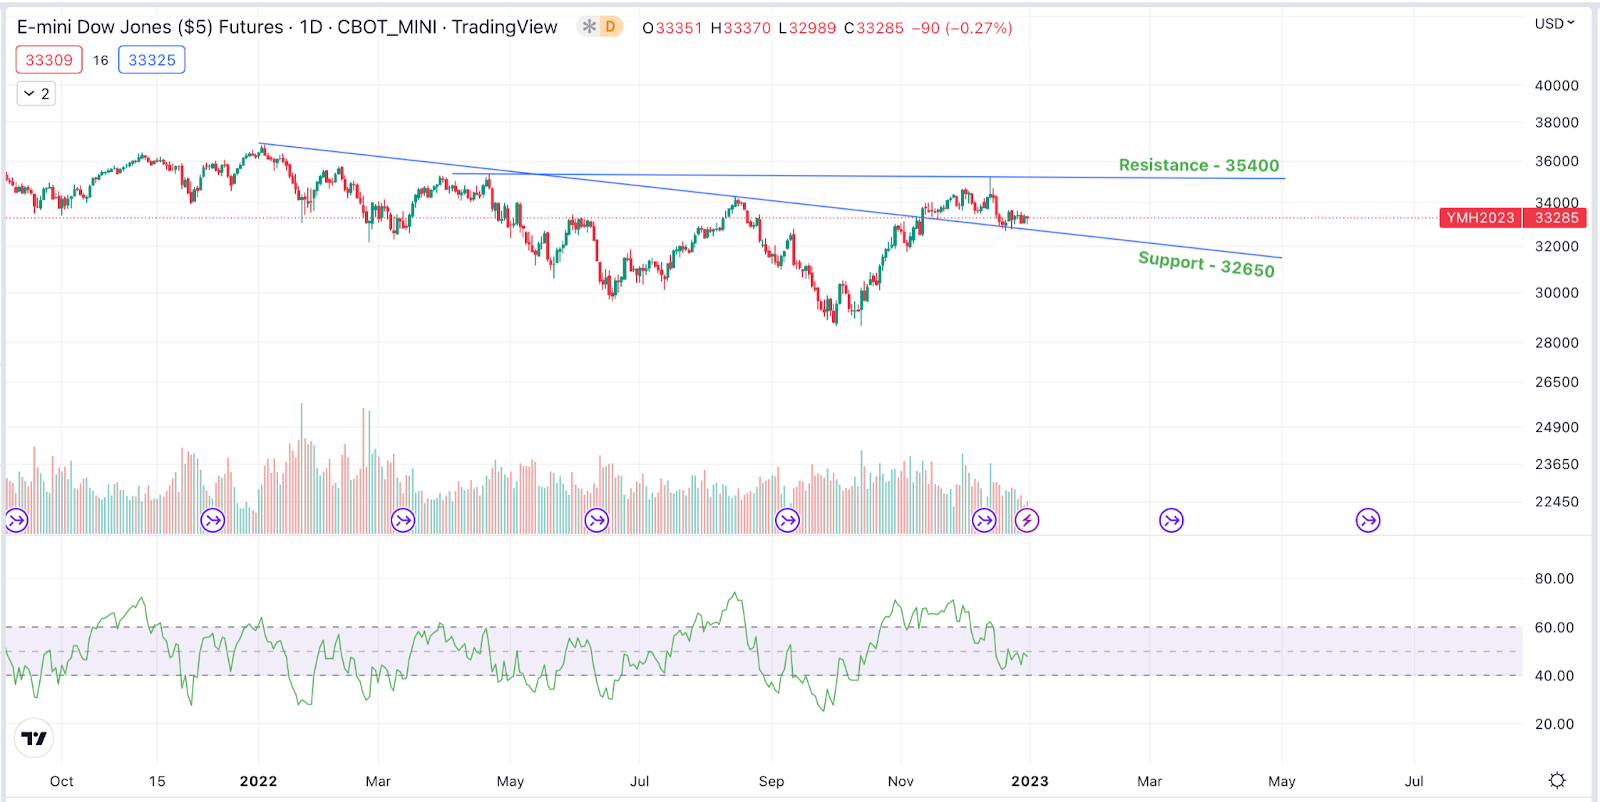
The Dow Jones Industrial Average corrected by -0.27% in the last week. The next resistance is expected at 35,400 and immediate support is expected at 32,650 levels.
Gold
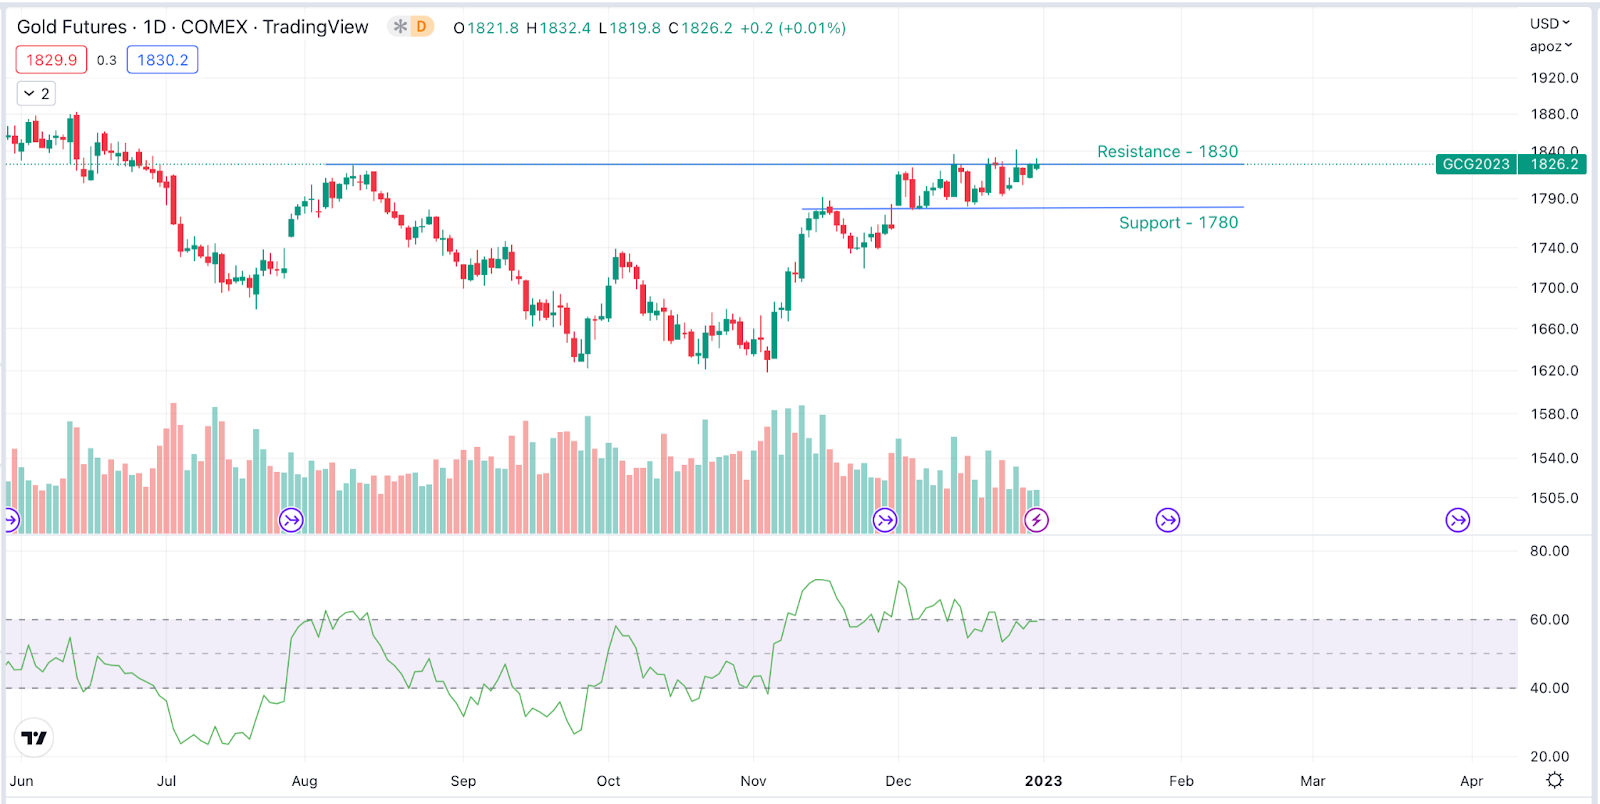
Gold Futures formed Inverted head and shoulder pattern and its trading within a range, trend reversal is expected. The next resistance is expected at $1,830 and immediate support is expected at $1,780
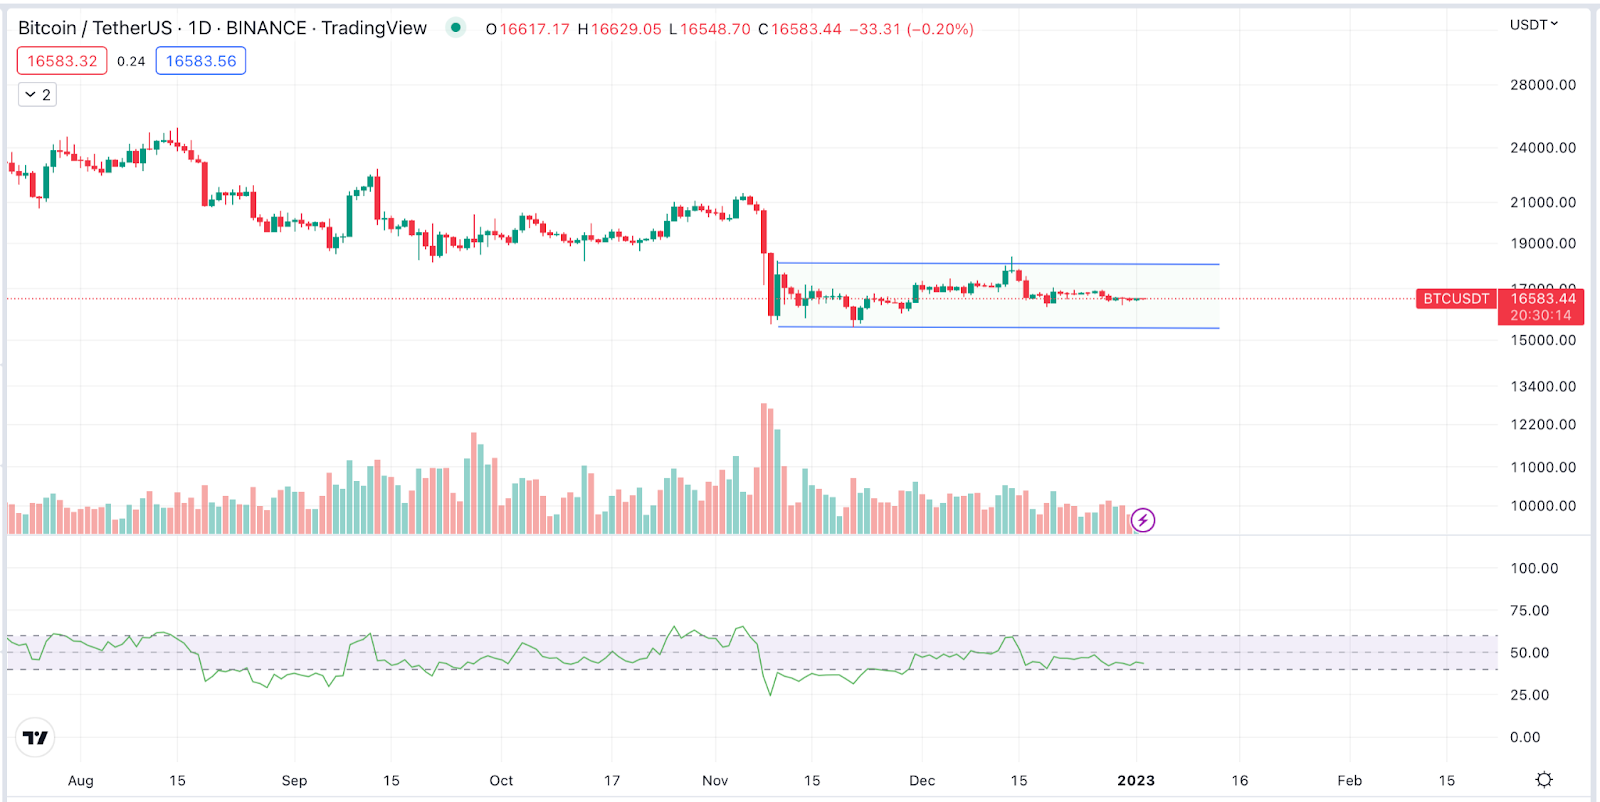
Bitcoin
Bitcoin is trading within the channel pattern. The next resistance is expected at $18, 388 and support at $15,476
ETHEREUM
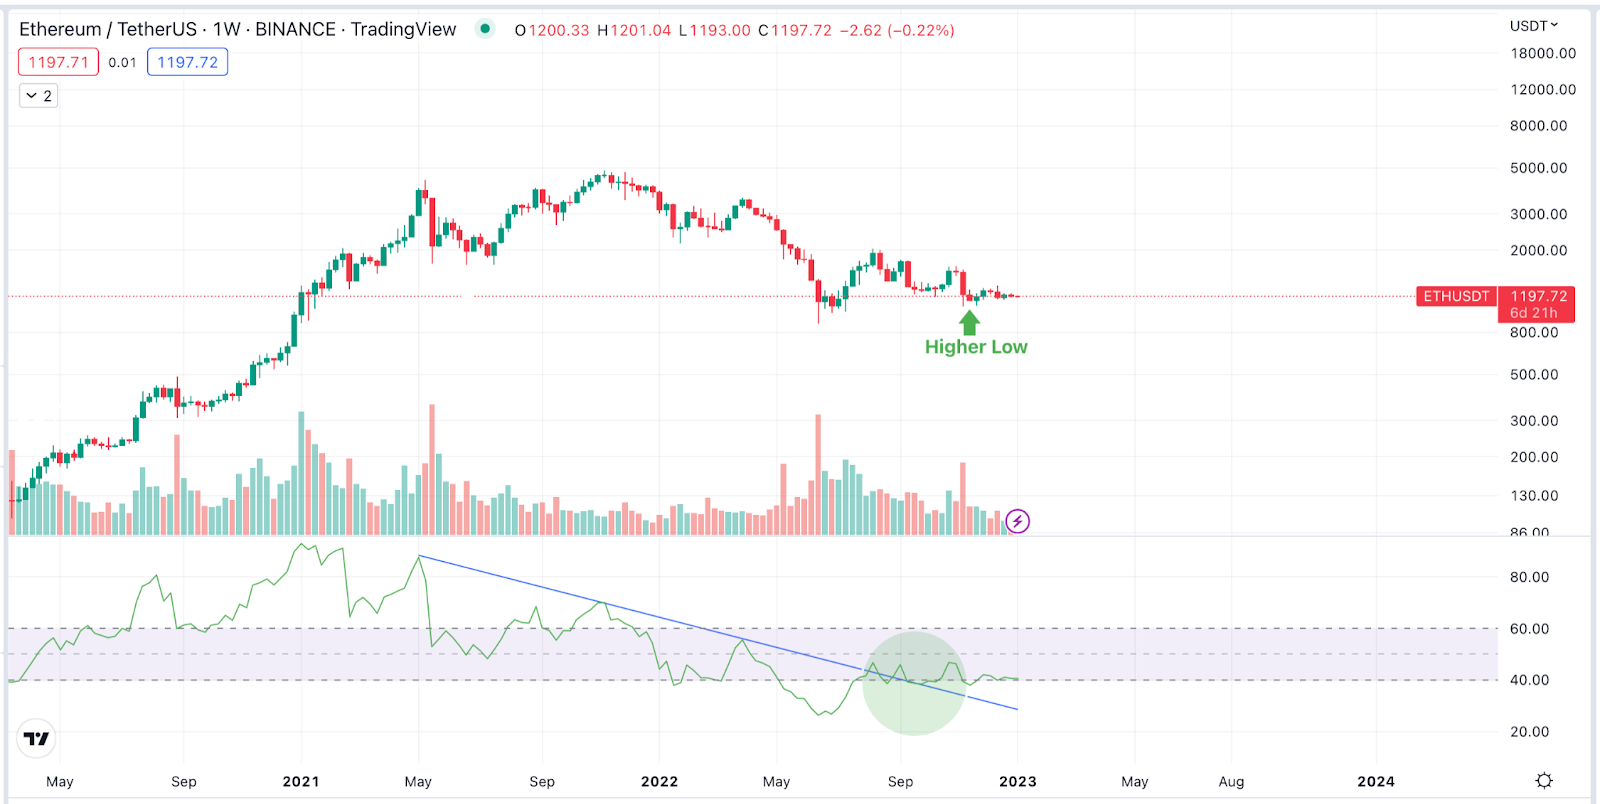
ETH RSI on a weekly timeframe has broken out of the descending trendline, also the price action is trading above the June 2022 low of $881.56 which is a higher low. This could be indication of trend reversal, the immediate support is expected at $1,073 and next resistance is expected at $2,030
Get deeper insights into the crypto market’s weekly trends discussed on ourSpotify podcast.
Start your Crypto Investments with XMINT Bots today
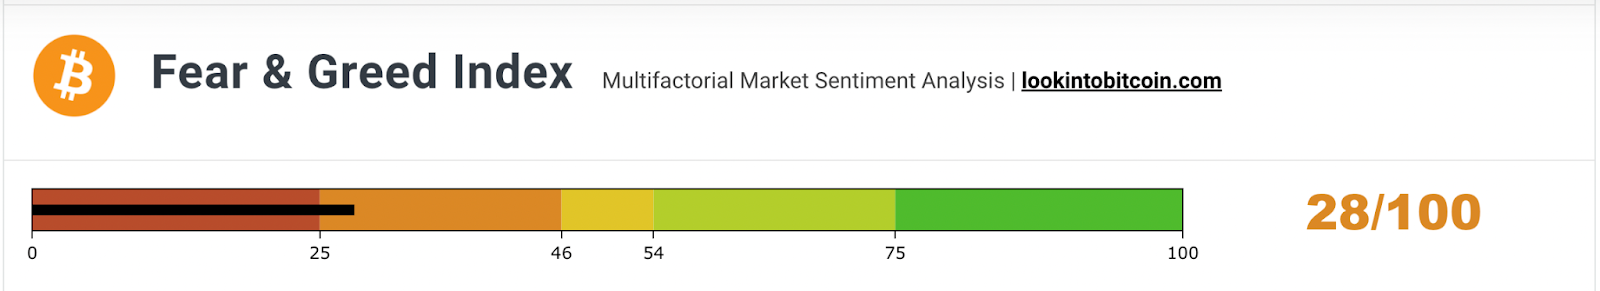
The sentiment towards the cryptocurrency market continues to remain in the Fear zone. Compared to last week’s, the Fear & Greed Index has changed marginally from “29” to “28”.
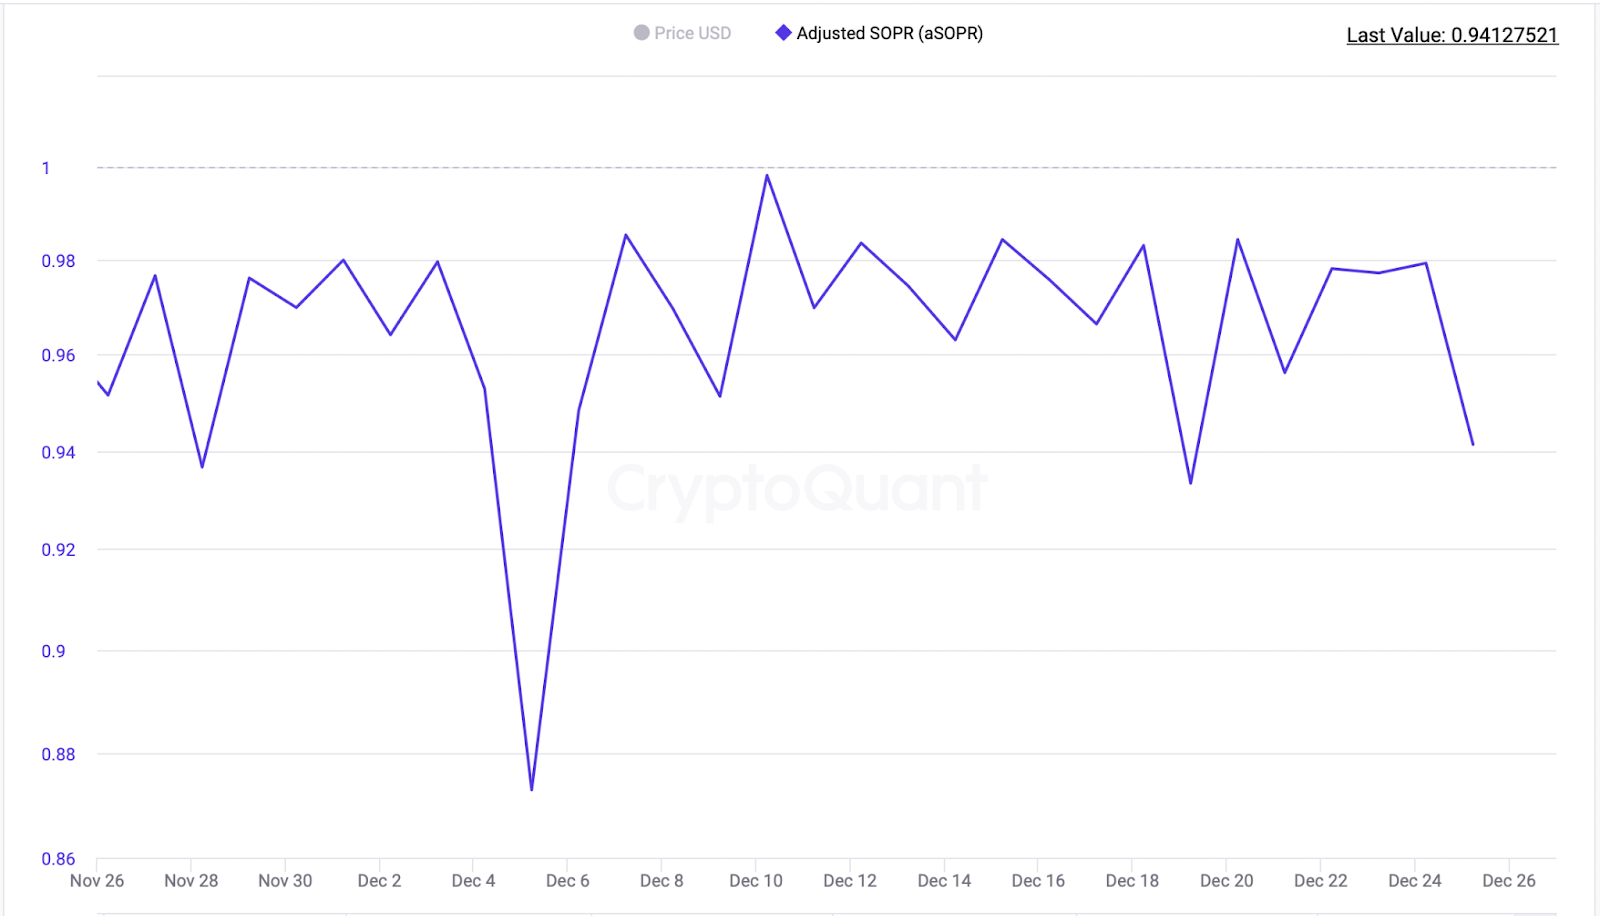
SOPR
Another data to evaluate the sentiment of the general public would be to look at Spent Output Profit Ratio (SOPR). What is SOPR? In layman terms, it indicates if people have sold their BTC at a profit or if they sold at a loss. An SOPR value above 1 indicates that profit booking dominated loss booking and below 1 indicates that loss booking dominated profit booking. A value of 1 indicates that the coins were sold at their purchase price. Adjusted SOPR filters out transactions that are younger than 1 hour, thus, clearing out noise from the metric.
aSOPR for this week stands at 0.94 which means the coins on average are being sold at loss by the investors
Is This The End of the Bear Market?
CVDD-BALANCED PRICE CHART INDICATOR
CVDD – tracks the cumulative sum of this value-time destruction as coins move from old hands into new hands as a ratio of the market age. It is then multiplied by 6 million, which is a somewhat arbitrary number as it is not linked to any relevant Bitcoin data.
The result is that it has historically correctly forecasted the major lows of Bitcoins price with good accuracy. Currently the CVDD stands at $17,140
BALANCED PRICE – This is an on-chain indicator used for Bitcoin price prediction at the bear market lows. This means that it is trying to identify the lowest price that Bitcoin may drop to in the future.
It is calculated by subtracting Transferred Price from Realized Price. Currently the BALANCED PRICE stands at $14,562
Balanced price has crossed below CVDD and Bitcoin price is trading below the cross. Historically the bottom formation was seen in such situations.
REALIZED PRICE
Realized price is defined as the average cost of acquisition based on every coin moved on-chain. In all the previous bear markets we see that the price trades below the realized price which indicates on average the coins held during this period have higher cost of acquisition than the current market price. Realized prices act as psychological support areas during bear markets.
The current price of Bitcoin is trading below the realized price of Bitcoin of 19,945 USD. For bull market confirmation, the market price of Bitcoin should be above realized price.
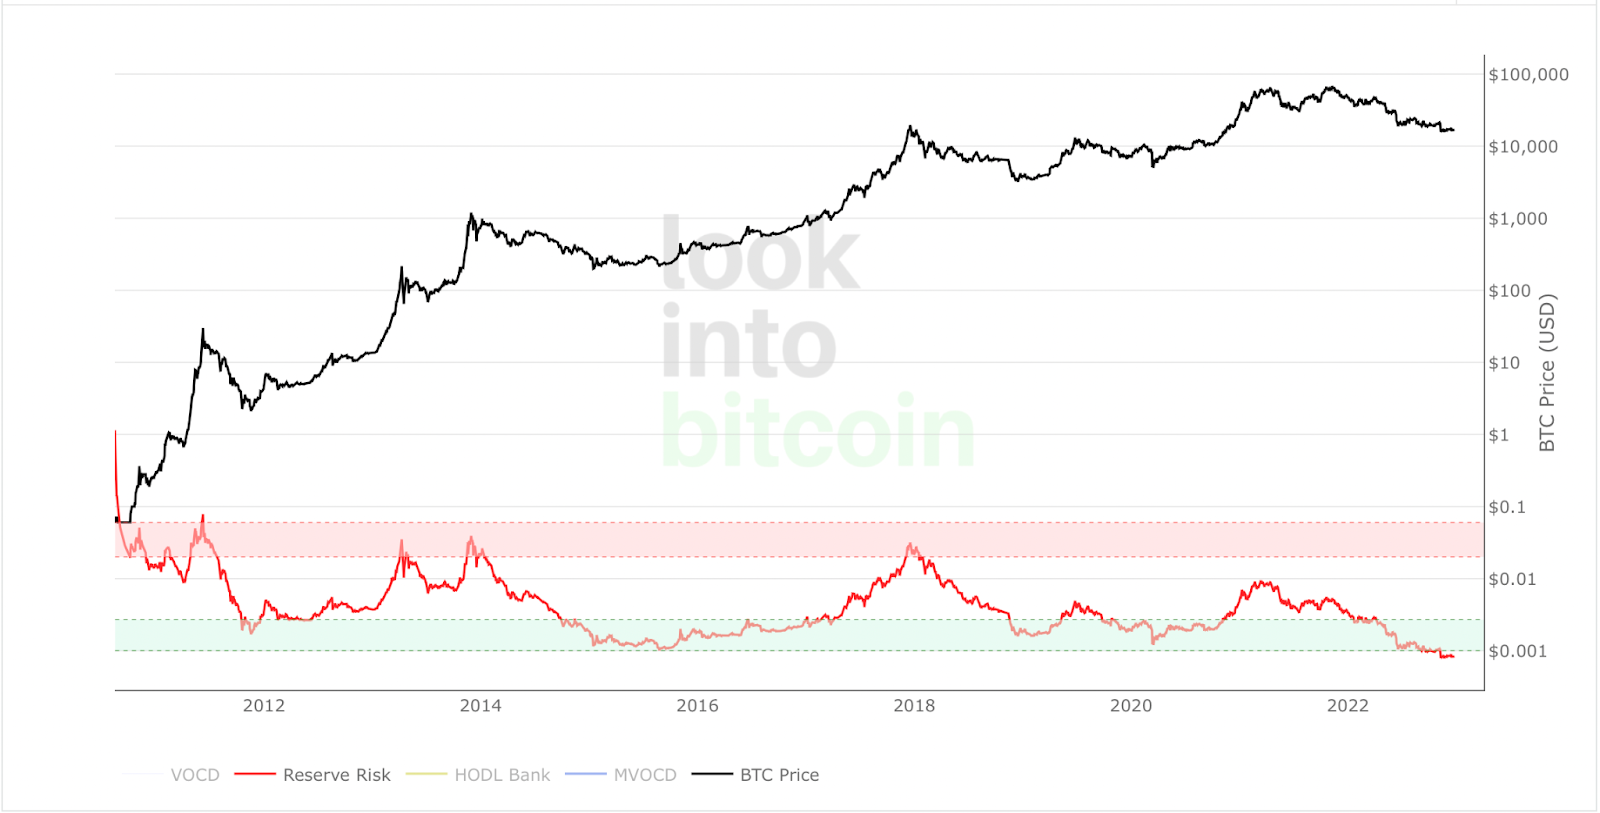
RESERVE RISK
Reserve Risk is a bitcoin chart that allows us to visualize the confidence amongst long term bitcoin holders relative to the price of Bitcoin at a given moment in time.
When confidence is high and price is low then there is an attractive risk/reward to invest in Bitcoin at that time (green zone). When confidence is low and price is high then risk/reward is unattractive (red zone). Investing in Bitcoin during periods where Reserve Risk is in the green zone has produced outsized returns over time, Currently reserve risk is in the deep green zone.
Overall Market Performance
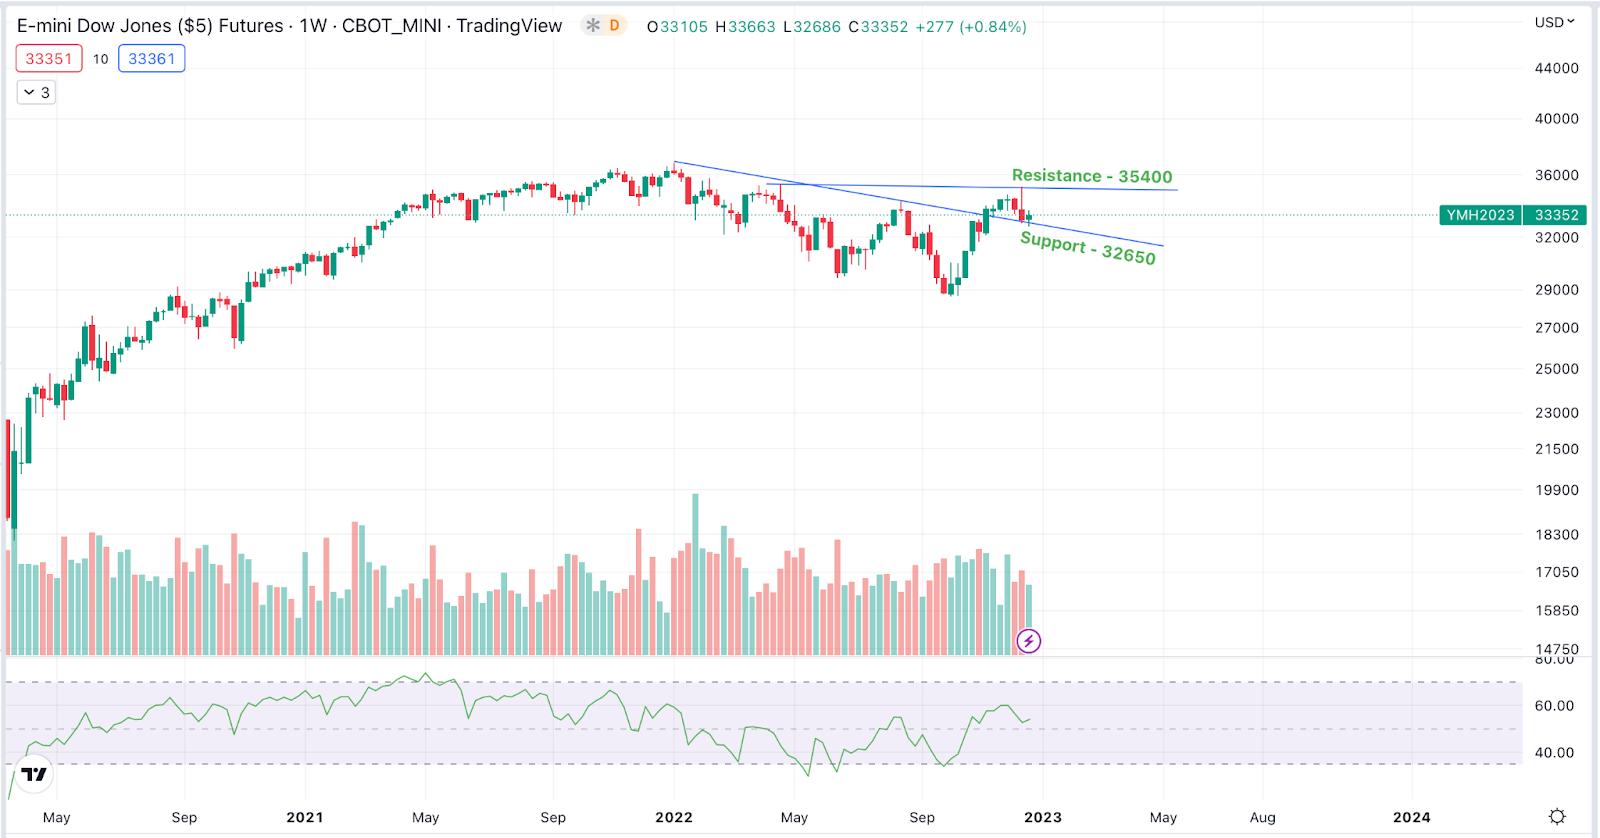
Dow Jones
The Dow Jones Industrial Average gained by 0.84% in the last week. The next resistance is expected at 35,400 and immediate support is expected at 32,650 levels.
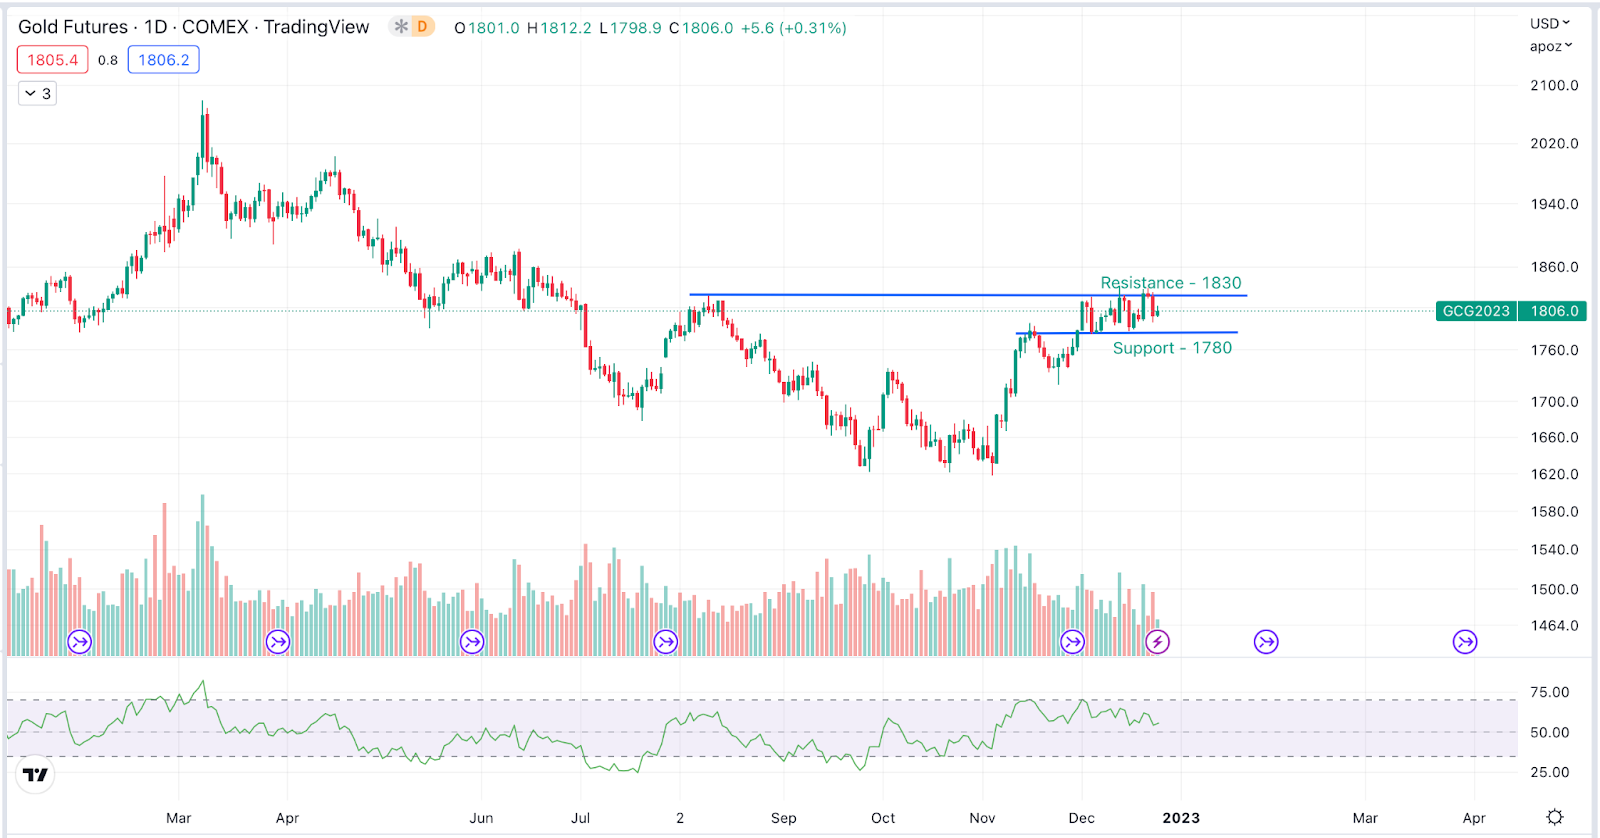
Gold
Gold Futures formed Inverted head and shoulder pattern, trend reversal is expected. The next resistance is expected at $1,830 and immediate support is expected at $1780
Bitcoin
Bitcoin has formed small candles on a weekly timeframe and RSI has broken the descending trendline, this could be an indication of trend reversal. The next resistance is expected at $21,500 and support at $15,500
ETHEREUM
ETH/BTC is showing a volatility contraction pattern which is an indication of a big move. The next resistance is expected at 0.080 and next support is expected at 0.065.
Highlights of the Week:
A team of Visa researchers and engineers have outlined a smart contract application for a self-custodial wallet on the Ethereum blockchain that could enable programmable payment instructions like automated bill payments through a bank account.
In Nigeria, a new bill is in the work in progress that could let local regulators recognize cryptocurrencies as capital for investment.
Japan’s ruling tax committee approved a proposal to exempt crypto startups that issue their own tokens from paying corporate taxes on unrealized gains.
Get deeper insights into the crypto market’s weekly trends discussed on ourSpotify podcast.
Start your Crypto Investments with XMINT Bots today