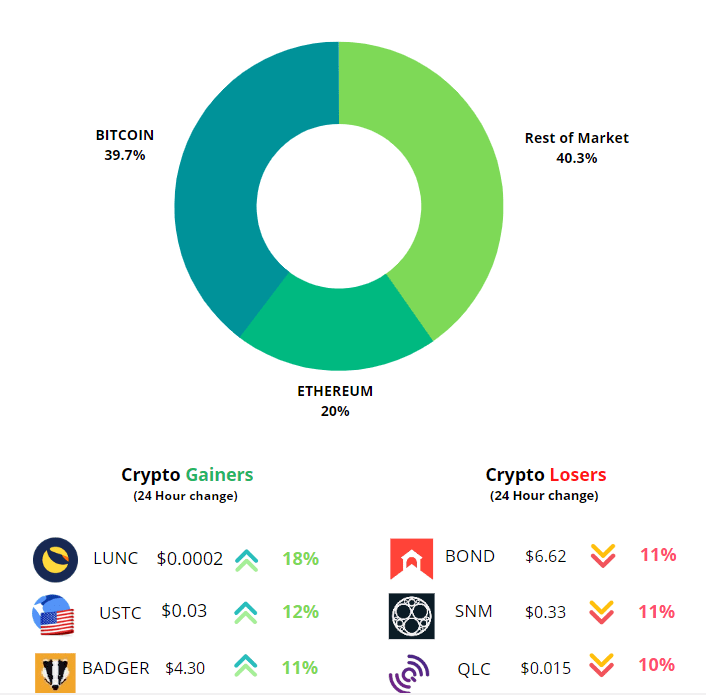
Crypto Market Dominance
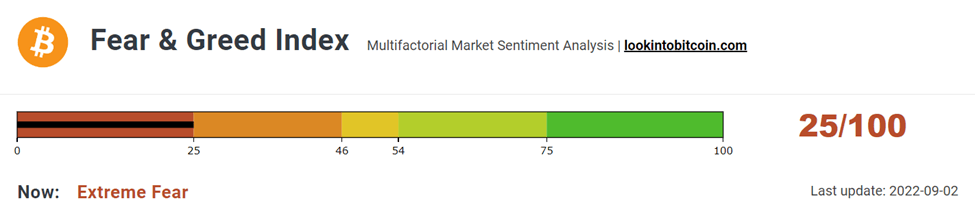
What is the general sentiment for Crypto?
After staying above the “extreme fear” zone in the “fear zone” for more than a month, the sentiment towards the cryptocurrency market has again shifted to the extreme fear zone. Currently, the index stands at “25”.
Another data to evaluate the sentiment of the general public would be to look at Spent Output Profit Ratio (SOPR). What is SOPR? In laymen terms, it indicates if people have sold at a profit or if they sold at a loss. An SOPR value above 1 indicates that profit booking dominated loss booking and below 1 indicates that loss booking dominated profit booking. A value of 1 indicates that the coins were sold at their purchase price. Adjusted SOPR filters out transactions that are younger than 1 hour, thus, clearing out noise from the metric.
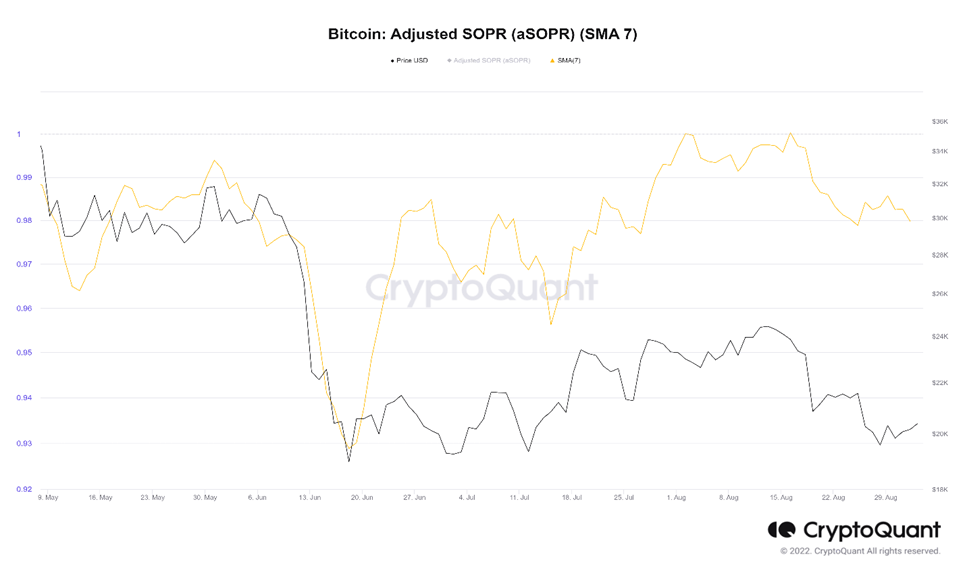
aSOPR for this week stands at 0.97 which means the coins on average are being sold at loss. Generally, we see that the metric value of 1 acts as resistance during bear market. For strong confirmation of trend reversal the metric should stay and oscillate above 1.
Where Are We In The Bear Market?
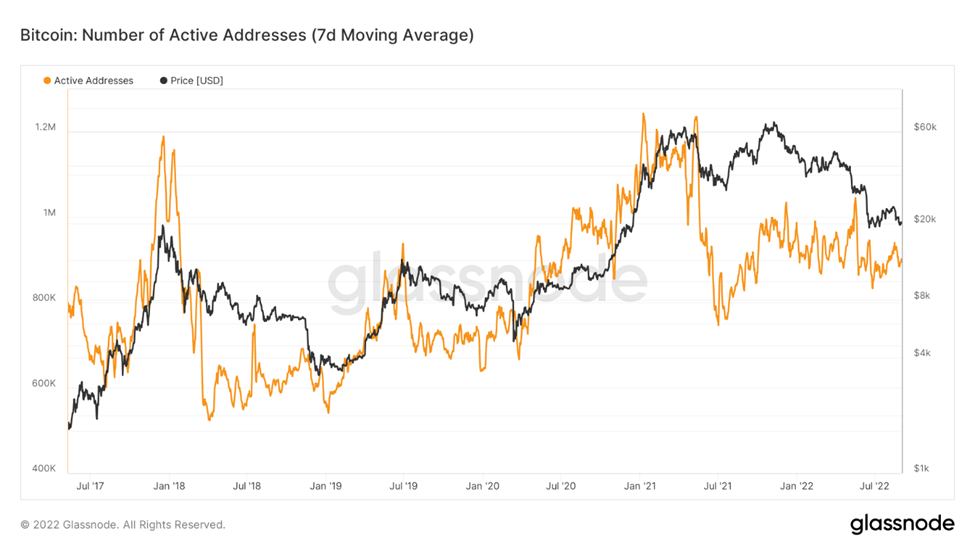
The number of active addresses is directly proportional to the number of active users. It is important to note that the number of active addresses doesn’t give the exact number of active users as a user might have more than one address.
During a bull market, the number of active addresses increases tremendously and a sharp fall is experienced as prices begin to fall showing weaker hands leaving the market. Historically, we have seen the metric startes oscillating within a range after the fall in the bear market and increases sharply as the market prepares to move out of the bear phase. In the current market, the metric is moving sideways showing that the market is sustained by the hodlers. We might see massive price movement once the metrics start making higher highs.
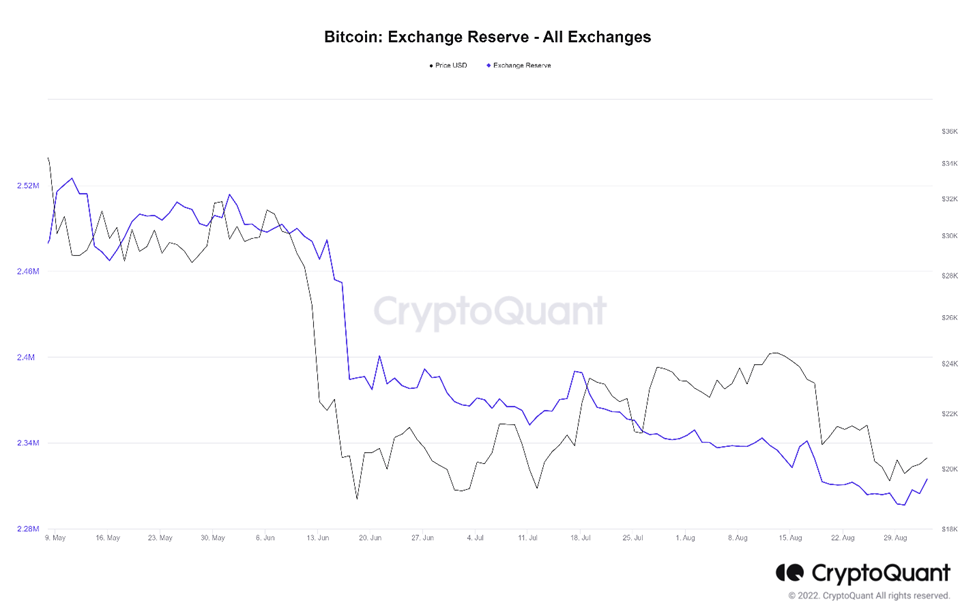
Exchange reserve is one of the important metrics to determine the potential number of coins with a high probability of getting spent in the market.
Exchange reserve increases: Liquid supply increases, selling pressure increases
Exchange reserve decreases: Illiquid supply increases, selling pressure decreases
Currently, the metric is near its three-year low. This increases the pool of illiquid supply, decreases the selling pressure, and increases the probability of price rise.
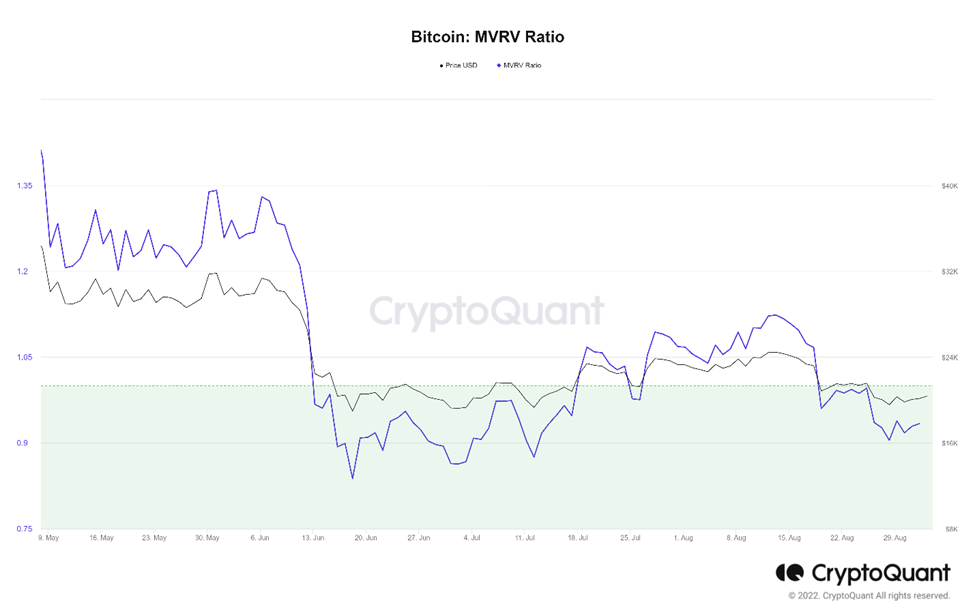
MVRV ratio is equal to the market capital divided by realized capital of Bitcoin. Realized capital unlike market capital does not use the current market price, but rather uses the prices of each Bitcoin when they last moved.
So, for example if the price of most of the Bitcoin when they last moved was $10,000 and the current price is $60,000. Then the MVRV ratio would stand at 6. This means that the market is extremely heated and profit booking is likely. On the other hand, if the of most of the Bitcoin when they last moved was near the market price, then the CMP can be considered as the bottom.
Currently, the metric stands at 0.93. In the previous bear markets, we have seen that the metric falls below 1 and oscillates below 1 for few days or months which mark the bottom of the bear market. As the metric moves above 1, the trend reverses.
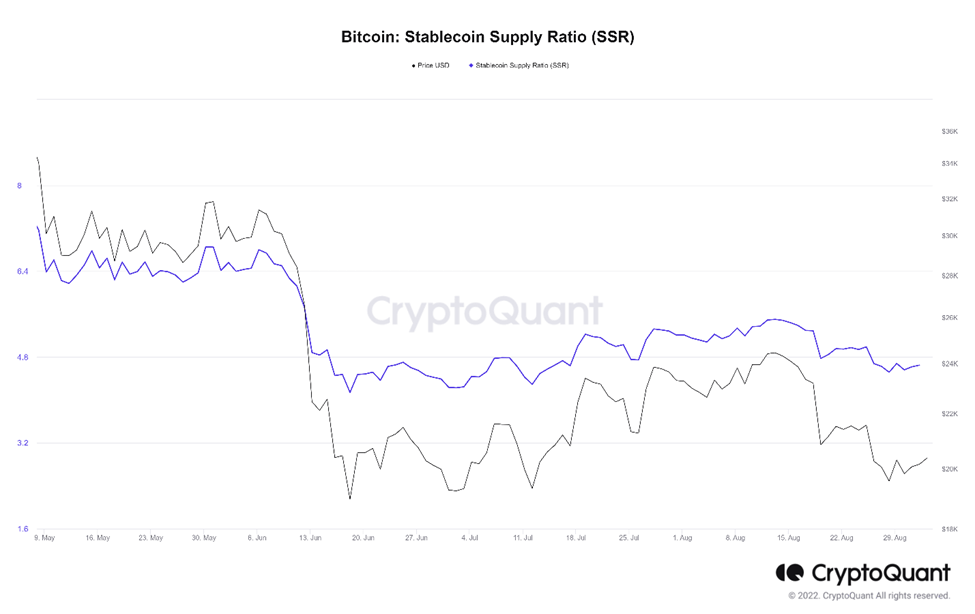
Stablecoin Supply Ratio (SSR) is the ratio of market cap of BTC divided by the market cap of all stablecoins.
- Low SSR value indicates high Stablecoin Supply compared to that of BTC market cap indicating potential buying pressure and possible price rise.
- High SSR value indicates low Stablecoin supply compared to the market cap of BTC indicating potential selling pressure and possible price fall.
Currently, SSR is at its bottom which means potential buying area of Bitcoins.
Overall Market Performance
Dow Jones
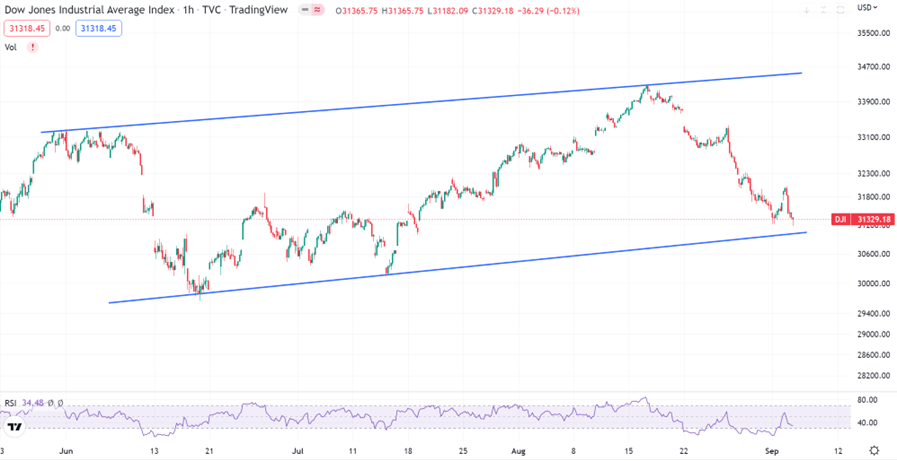
Dow Jones Industrial Average dropped by 3% in the previous week as the Dollar index continued to strengthened. The hourly trend for Dow Jones has formed a channel pattern, trading close to the bottom trendline. The next support is expected at 29,600 level.
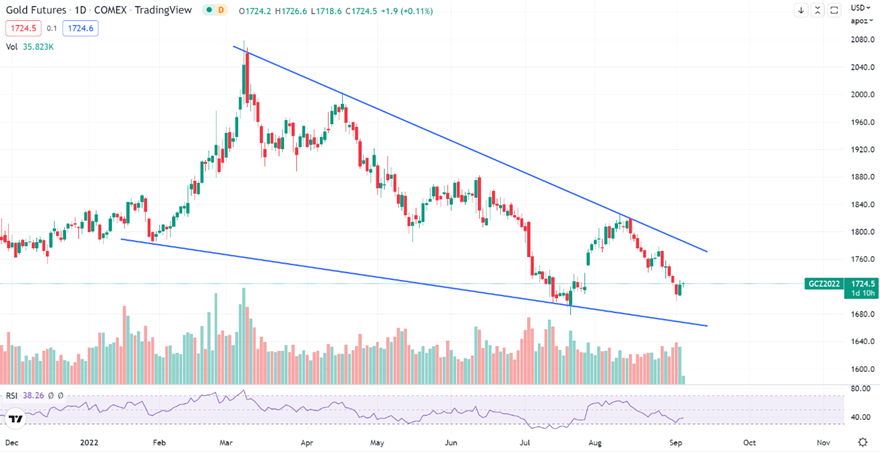
Gold
Gold Futures dipped by over 1.5% over the last week. The daily trend for Gold is moving withing the descending triangle pattern. The next resistance for Gold is expected at $1,840 and next support is expected at $1,680
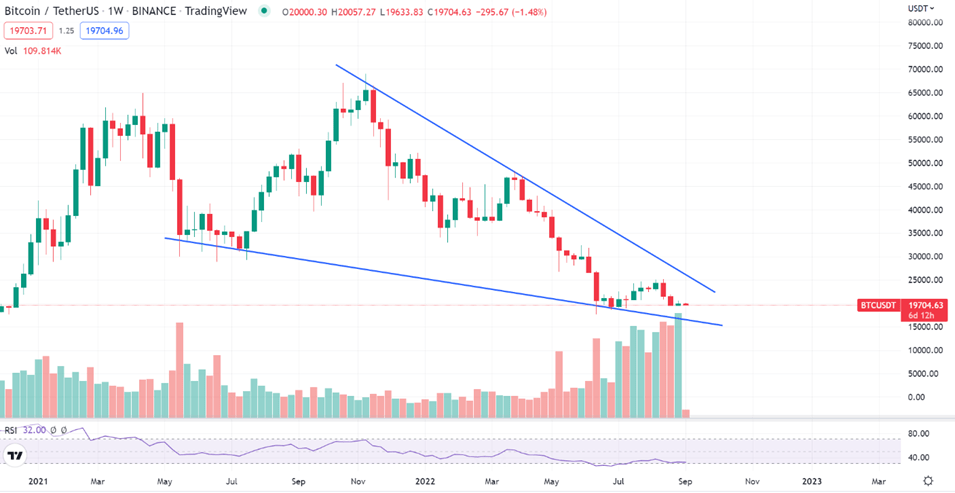
Bitcoin
Bitcoin gained over 2% in the past week after closing in Red for the 2 weeks prior to that. The weekly trend for BTC is traversing within a descending triangle pattern. The next resistance is expected at $32.3K and key support is expected at $19K.
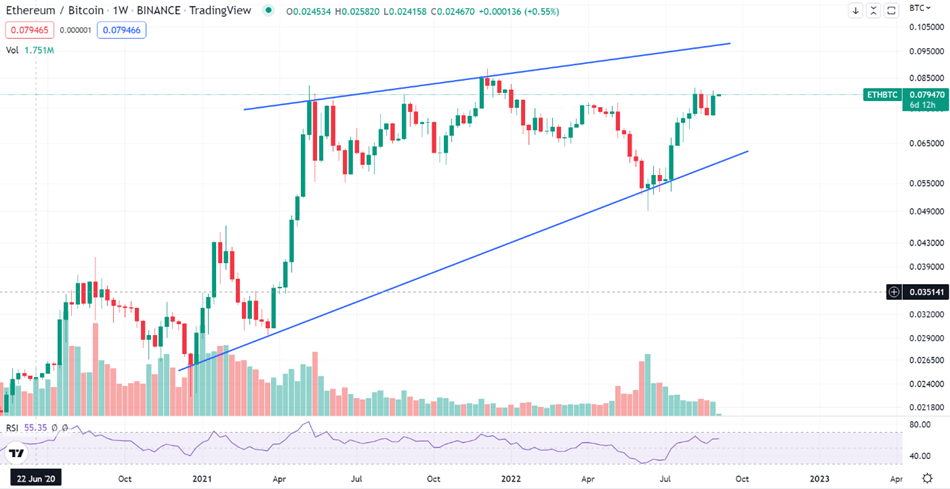
ETHEREUM
Ethereum gained over 8% against Bitcoin during the last week as Bitcoin Dominance index continued to weaken. The weekly trend for ETH-BTC is moving within an ascending triangle pattern. The next resistance is expected at 0.088.
Highlights of the week

Dutch blockchain startup Triall announced that it has
partnered with American nonprofit medical center Mayo
Clinic & the Triall’s eClinical platform will support a 2-year
multi-center pulmonary arterial hypertension clinical trial
that includes 10 research sites & more than 500 patients
across USA.

Meta highlighted that users can now post NFTs on both
social platforms by connecting their digital wallets from
either of the apps & this integration may spark the broader
adoption of digital collectibles.

“We want to build the ecosystem in India. We didn’t want to
just build a company, to make revenues. The larger goal is
how can we take India to a global stage and while that is
happening, we be the catalyst in terms of making that
happen,” said Sumit Gupta, CoinDCX co-founder and Chief
Executive Officer.
Our Pick of the Week

Enjin (ENJ)
We expect a gain of 10% from the Buy Price of 0.5229 USDT and
outperform BTC in the coming week.
Get deeper insights into the crypto market’s weekly trends discussed on our Spotify podcast.
Start your Crypto Investments with XMINT Bots today