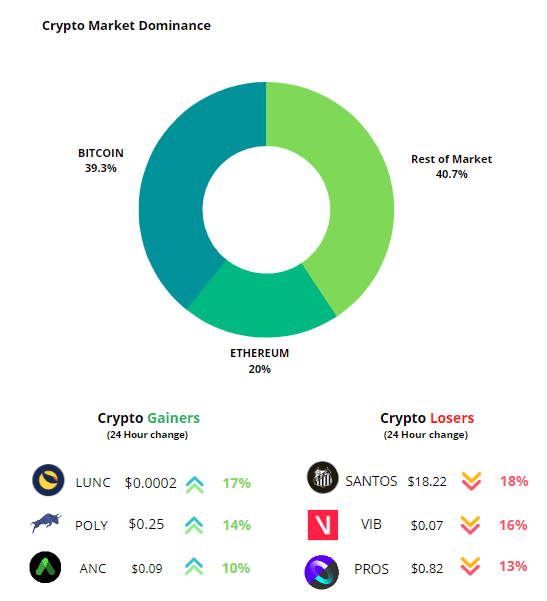
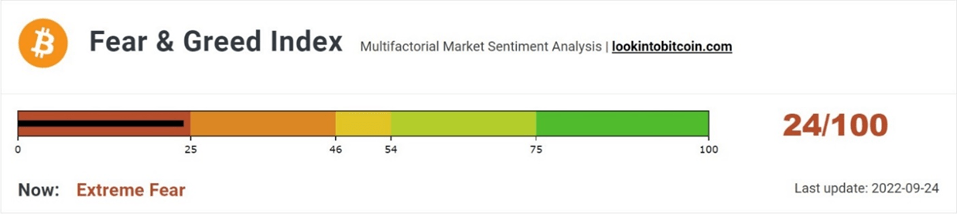
What is the general sentiment for Crypto?
The sentiment towards the cryptocurrency market is in the extreme fear zone and compared to last week’s, the Fear & Greed Index has moved from “fear” to “extreme fear” zone. The metric currently not stands at “24”.
Another data to evaluate the sentiment of the general public would be to look at Spent Output Profit Ratio (SOPR). What is SOPR? In laymen terms, it indicates if people have sold at a profit or if they sold at a loss. An SOPR value above 1 indicates that profit booking dominated loss booking and below 1 indicates that loss booking dominated profit booking. A value of 1 indicates that the coins were sold at their purchase price. Adjusted SOPR filters out transactions that are younger than 1 hour, thus, clearing out noise from the metric.
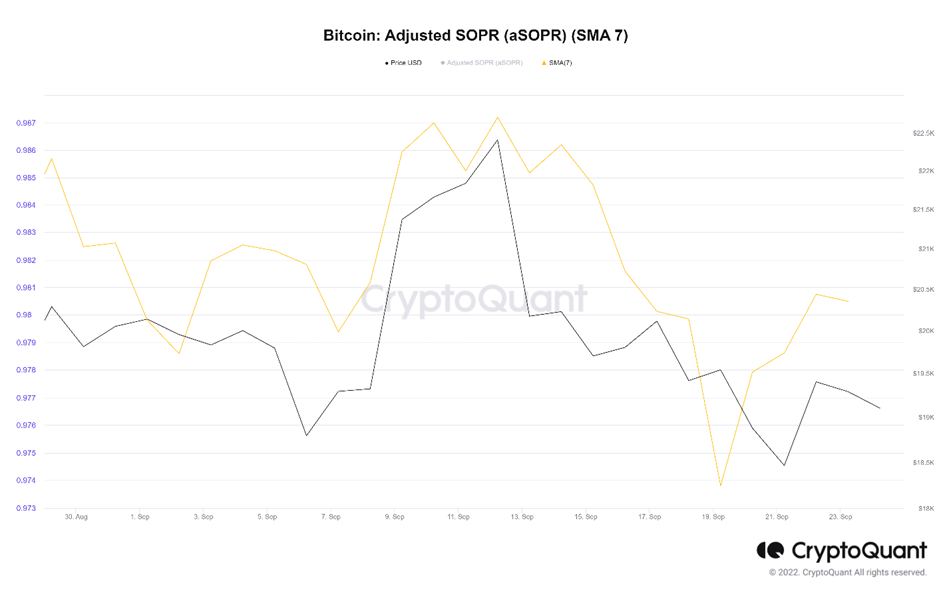
aSOPR for this week stands at 0.98 which means the coins on average are being sold at loss. Generally, we see that the metric value of 1 acts as resistance during bear market. For strong confirmation of trend reversal the metric should stay and oscillate above 1.
Where Are We In The Bear Market?
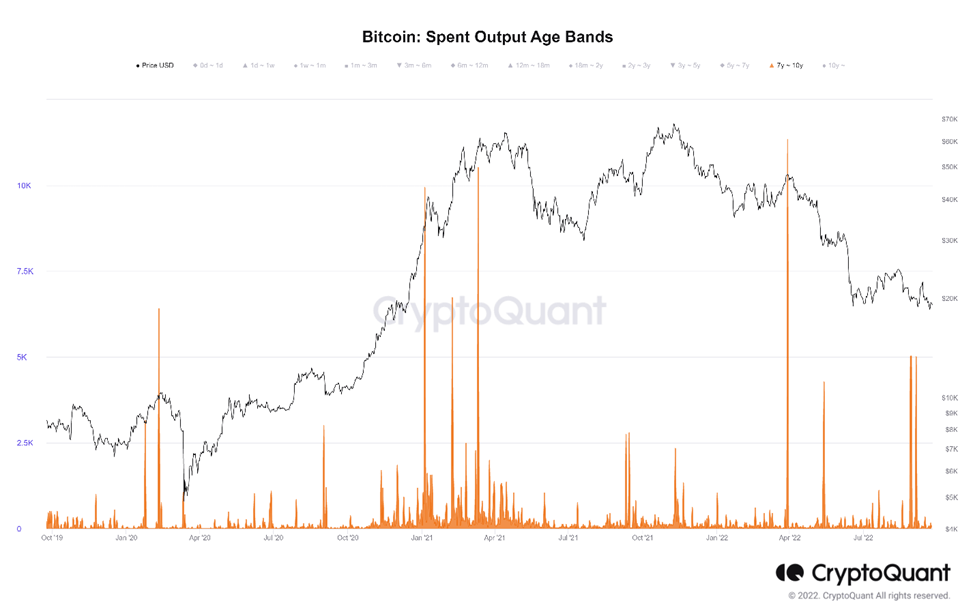
Whenever a coin is moved on-chain, unspent output or a UTXO is created which holds the volume of BTC. From the time UTXOs are created up until the time they are spent , UTXOs accumulate lifespan known as age. Spent Output Age Bands helps in analysing the lifespan accumulated by each of the spent outputs on any particular day.
From the graph, we see that more than 5,000 UTXOs with the lifespan of more than 7 years were spent on-chain and historically, whenever the UTXOs with age more than 7 years were spent we have seen drop in prices.
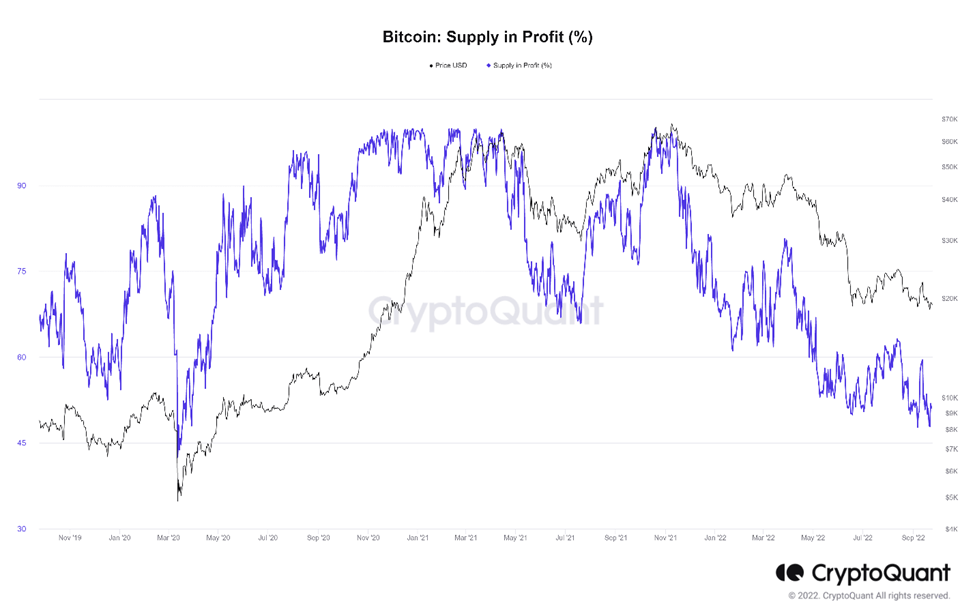
The total supply in profit is calculated by summing all the Bitcoins whose price at the time they last moved is lower than the current market price.
Generally, during bear consolidation phase we see that the investors who had bought coins at high level panic and redistribute their coins. Thus, during this period we see high volatility in the metric. After the redistribution of the coins, the cost basis of investors decreases and with a small percentage increase in price, the metric moves significantly. Currently,only 51% of the total supply is in profit and the metric is showing high volatility as the market is in the consolidation phase.
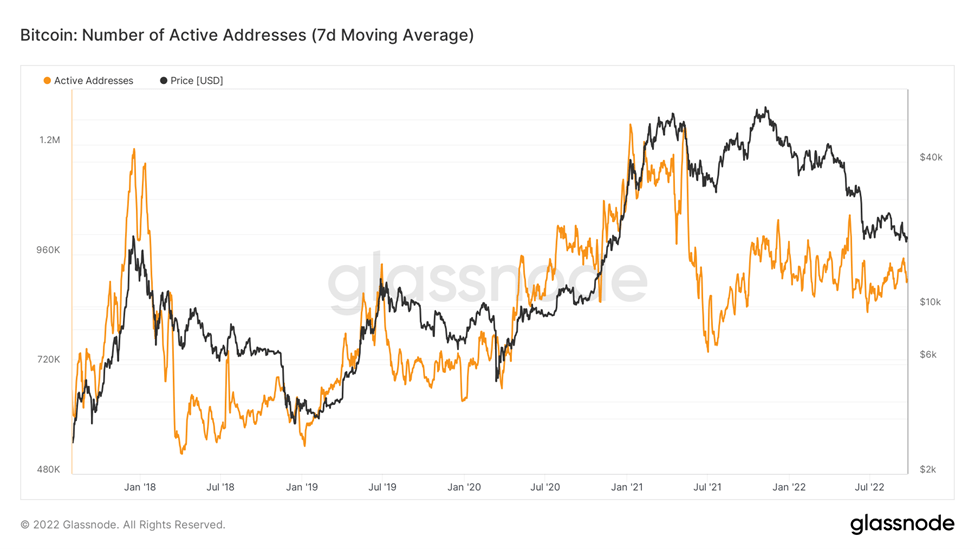
The number of active addresses is directly proportional to the number of active users. It is important to note that the number of active addresses doesn’t give the exact number of active users as a user might have more than one address.
During a bull market, the number of active addresses increases tremendously and a sharp fall is experienced as prices begin to fall showing weaker hands leaving the market. Historically, we have seen the metric startes oscillating within a range after the fall in the bear market and increases sharply as the market prepares to move out of the bear phase. Currently, the metric is moving within a range (sideways movement).
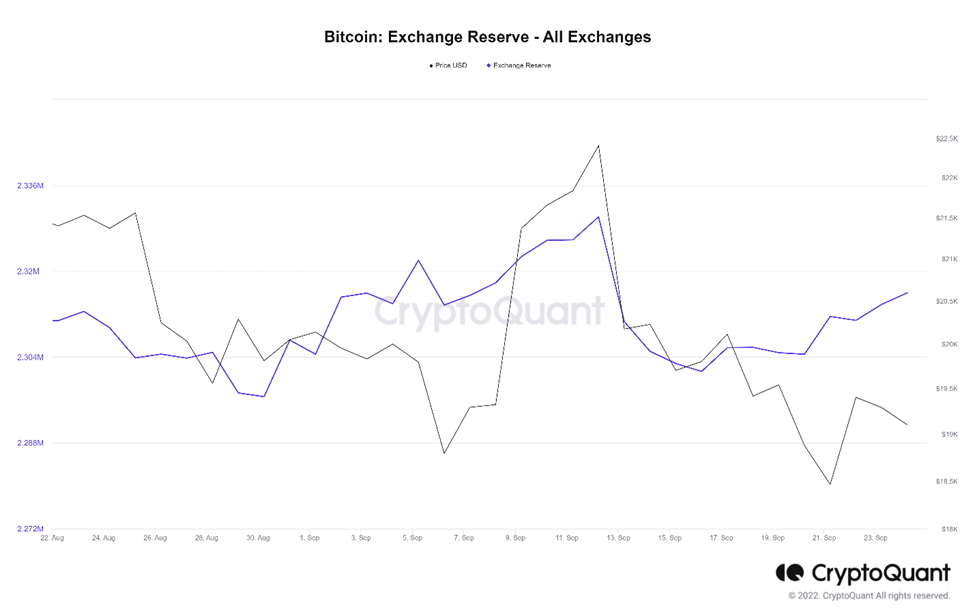
Exchange reserve is one of the important metrics to determine the potential number of coins with a high probability of getting spent in the market.
Exchange reserve increases: Liquid supply increases, selling pressure increases
Exchange reserve decreases: Illiquid supply increases, selling pressure decreases
Exchange Reserve is showing an increasing trend whereas price is decreasing . This might increase selling pressure and hence, price volatility can be seen in the next few days.
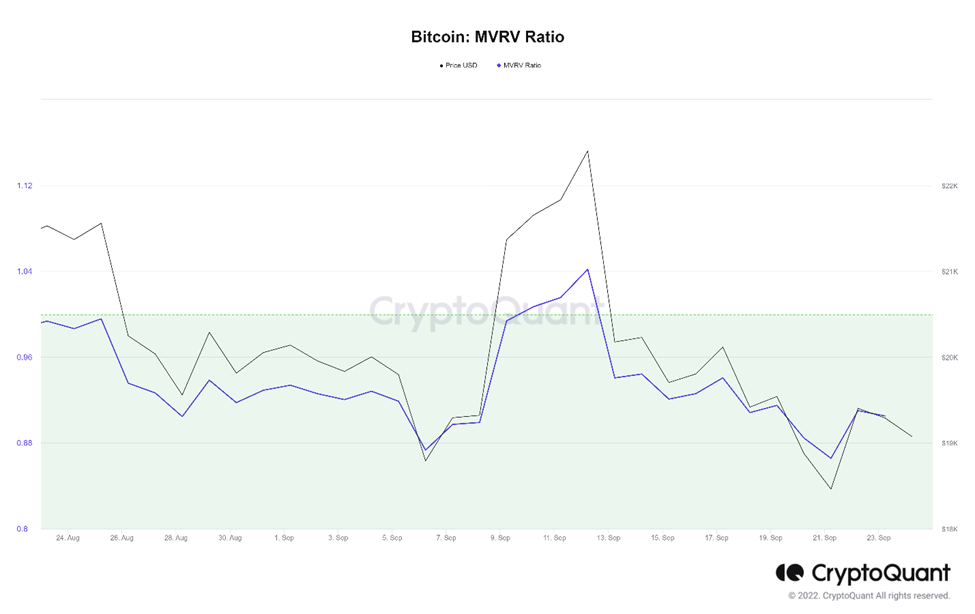
MVRV ratio is equal to the market capital divided by realized capital of Bitcoin. Realized capital unlike market capital does not use the current market price, but rather uses the prices of each Bitcoin when they last moved.
So, for example if the price of most of the Bitcoin when they last moved was $10,000 and the current price is $60,000. Then the MVRV ratio would stand at 6. This means that the market is extremely heated and profit booking is likely. On the other hand, if the of most of the Bitcoin when they last moved was near the market price, then the CMP can be considered as the bottom.
Currently, the metric stands at 0.9. In the previous bear markets, we have seen that the metric falls below 1 and oscillates below 1 for few days or months which mark the bottom of the bear market. As the metric moves above 1, the trend reverses.
Overall Market Performance
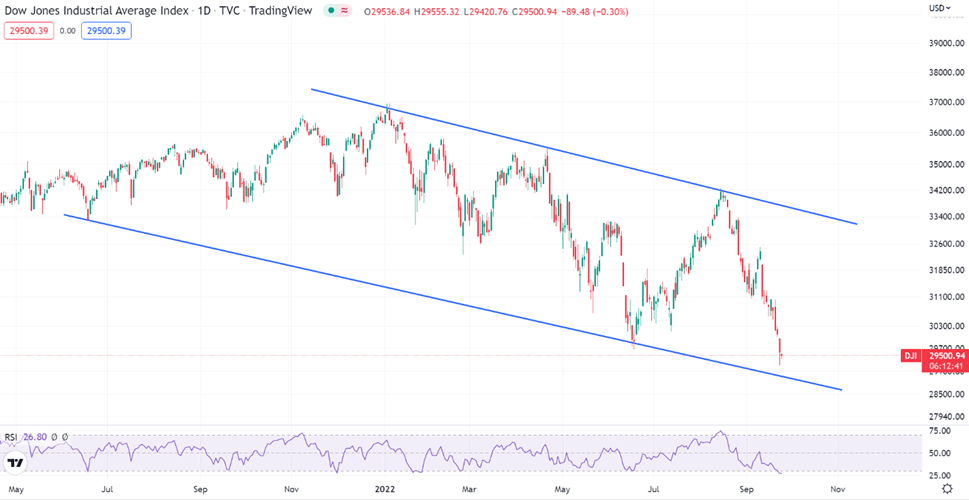
Dow Jones
Dow Jones Industrial Average dropped by 4% yet again as the Dollar Index strengthened. The daily trend for Dow Jones has formed a descending channel pattern. The next support is expected at 27,800 level.
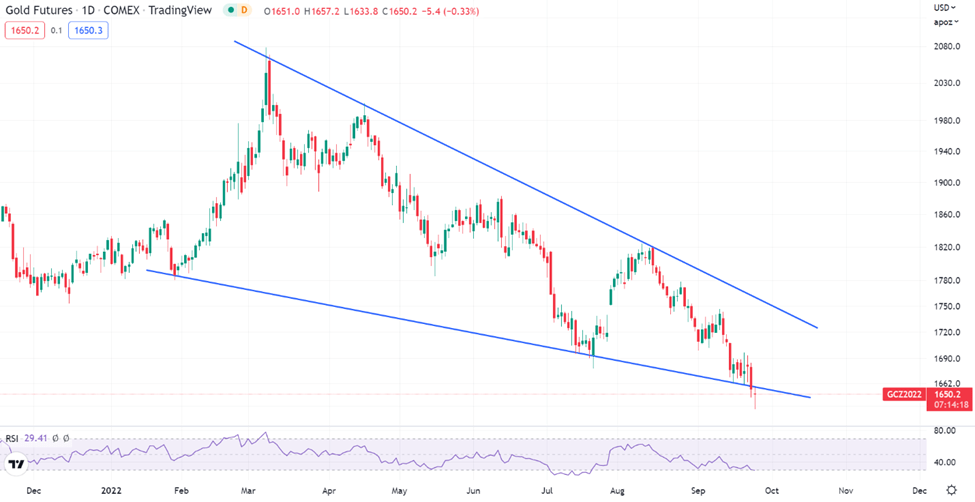
Gold
Gold Futures closed in negative, dropping by nearly 2% in the previous week. The daily trend for Gold has also broken below the descending triangle pattern. The next support is expected at $1,532
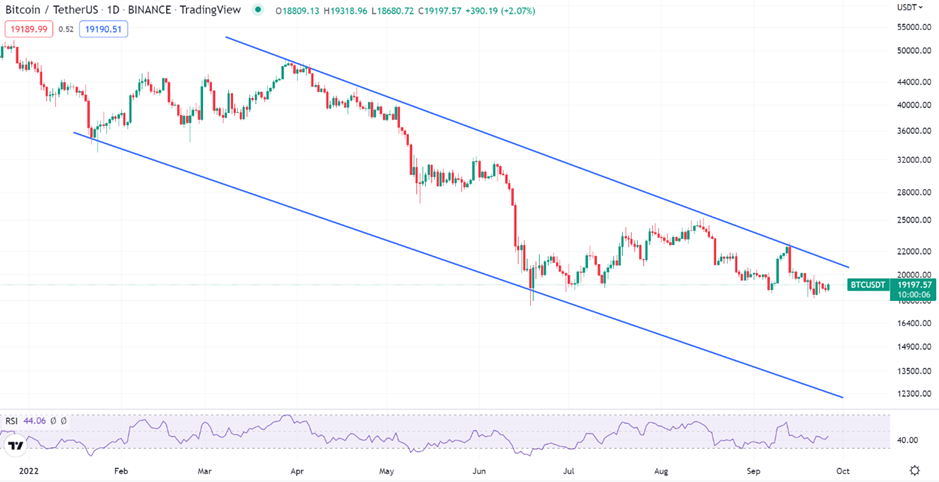
Bitcoin
Bitcoin plummeted by over 3% in the past week, dropping below the $19K levels. The daily trend for BTC continues to traverse within a descending channel pattern. The next resistance is expected at $32.3K and key support is expected at $17.9K
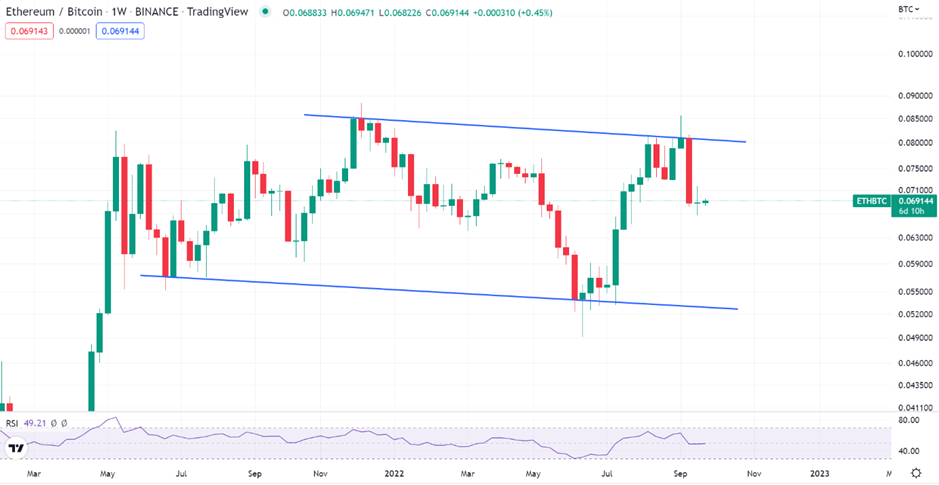
ETHEREUM
Ethereum remained fairly neutral against Bitcoin, last week. The weekly trend for ETH-BTC is moving within the descending channel pattern. The next resistance is expected at 0.088 and next support is expected at 0.063.
Highlights of the week

TravelX is a marketplace for tokenized travel products. The
platform currently offers 2.5 million tickets. After acquiring
an NFTicket, a customer can auction, sell, transfer, gift or
exchange them through a peer-to-peer system.

Coinbase, the largest U.S. cryptocurrency exchange, won a
regulatory approval from the Dutch central bank that will
eventually give it the ability to offer services in the entire
European Union.

MicroStrategy bought 301 BTC during the dip for
approximately $6.0 million in cash, at an average price of
$19,851 per bitcoin.
Our Pick of the Week

Santos FC Fan Token (SANTOS)
We expect a gain of 10% from the Buy Price of 1 USDT and
outperform BTC in the coming week.
Get deeper insights into the crypto market’s weekly trends discussed on our Spotify podcast.
Start your Crypto Investments with XMINT Bots today