WEEKLY CRYPTO MARKET REPORT – 29th JAN 2023
What is the general sentiment for Crypto?
The sentiment towards the cryptocurrency market turns to GREED. Compared to last week, the Fear & Greed Index has changed from “50” to “61”.

SOPR
Another data to evaluate the sentiment of the general public would be to look at Spent Output Profit Ratio (SOPR). What is SOPR? In layman terms, it indicates if people have sold their BTC at a profit or if they sold at a loss. An SOPR value above 1 indicates that profit booking dominated loss booking and below 1 indicates that loss booking dominated profit booking. A value of 1 indicates that the coins were sold at their purchase price. Adjusted SOPR filters out transactions that are younger than 1 hour, thus, clearing out noise from the metric.
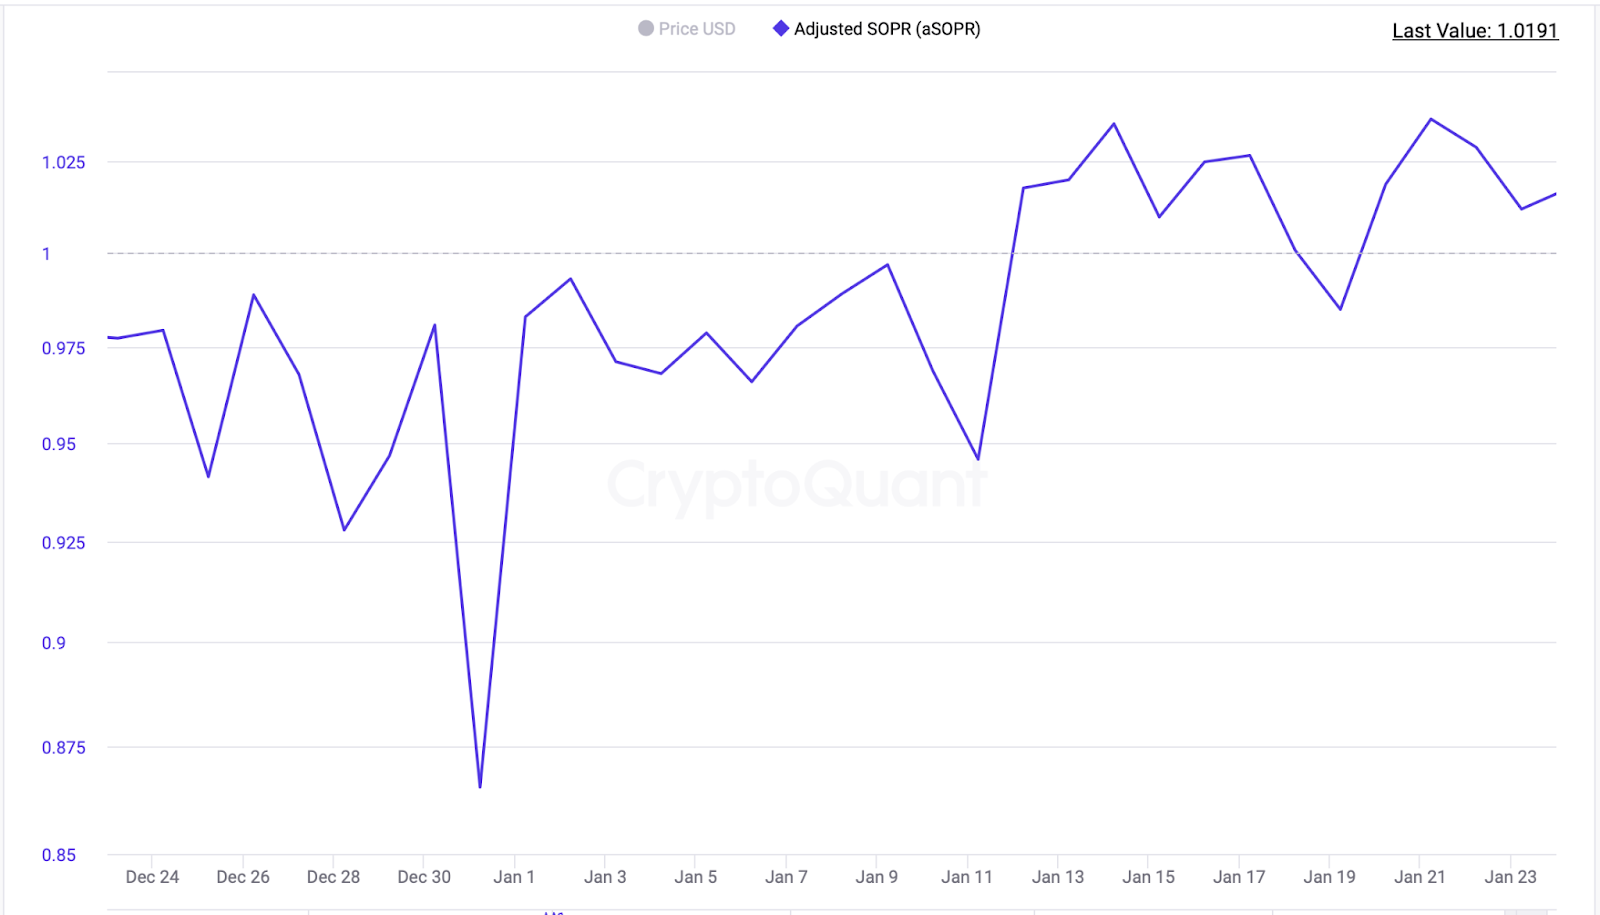
aSOPR for this week stands at 1 which means the coins were sold at their purchase price
Is This The End of the Bear Market?
CVDD-TERMINAL PRICE CHART INDICATOR
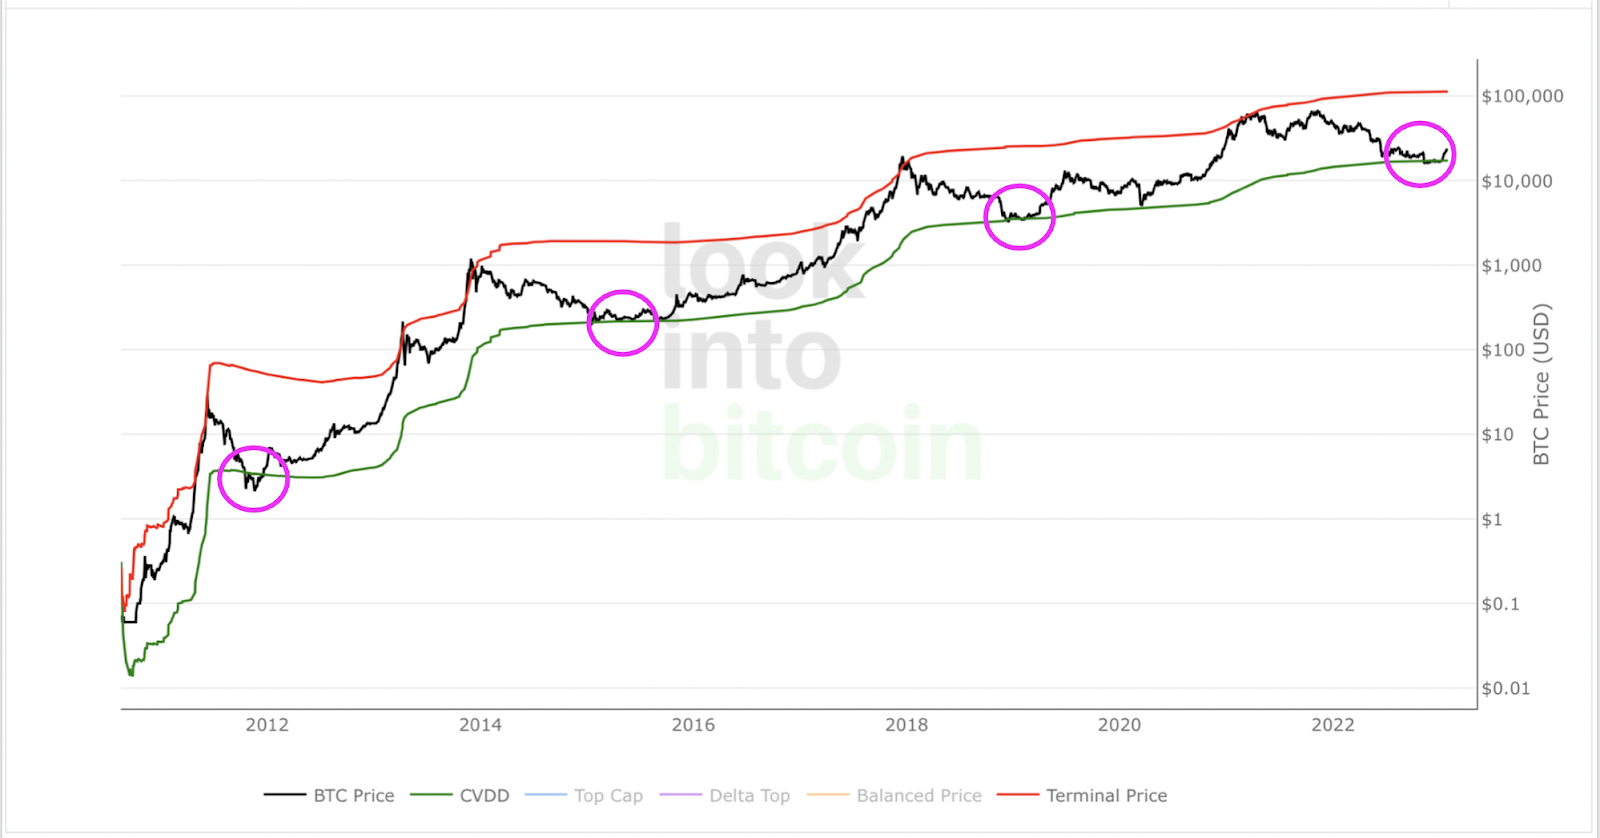
TERMINAL PRICE – This is an on-chain indicator. That means it uses data from the Bitcoin blockchain to identify actual user behavior and activity.Before Terminal price is calculated, it is first necessary to calculate Transferred Price. Transferred price takes the sum of Coin Days Destroyed and divides it by the existing supply of bitcoin and the time it has been in circulation. The value of Transferred Price is then multiplied by 21.This Terminal Price has historically been very effective at forecasting the tops of Bitcoin price cycles. Currently the TERMINAL PRICE stands at $112,687
CVDD – tracks the cumulative sum of this value-time destruction as coins move from old hands into new hands as a ratio of the market age. It is then multiplied by 6 million, which is a somewhat arbitrary number as it is not linked to any relevant Bitcoin data. The result is that it has historically correctly forecasted the major lows of Bitcoins price with good accuracy.
Currently the Bitcoin CVDD stands at $17,239 which acts as the long term support levels, Bitcoin Price bounced back from here as expected
MVRV Z-Score
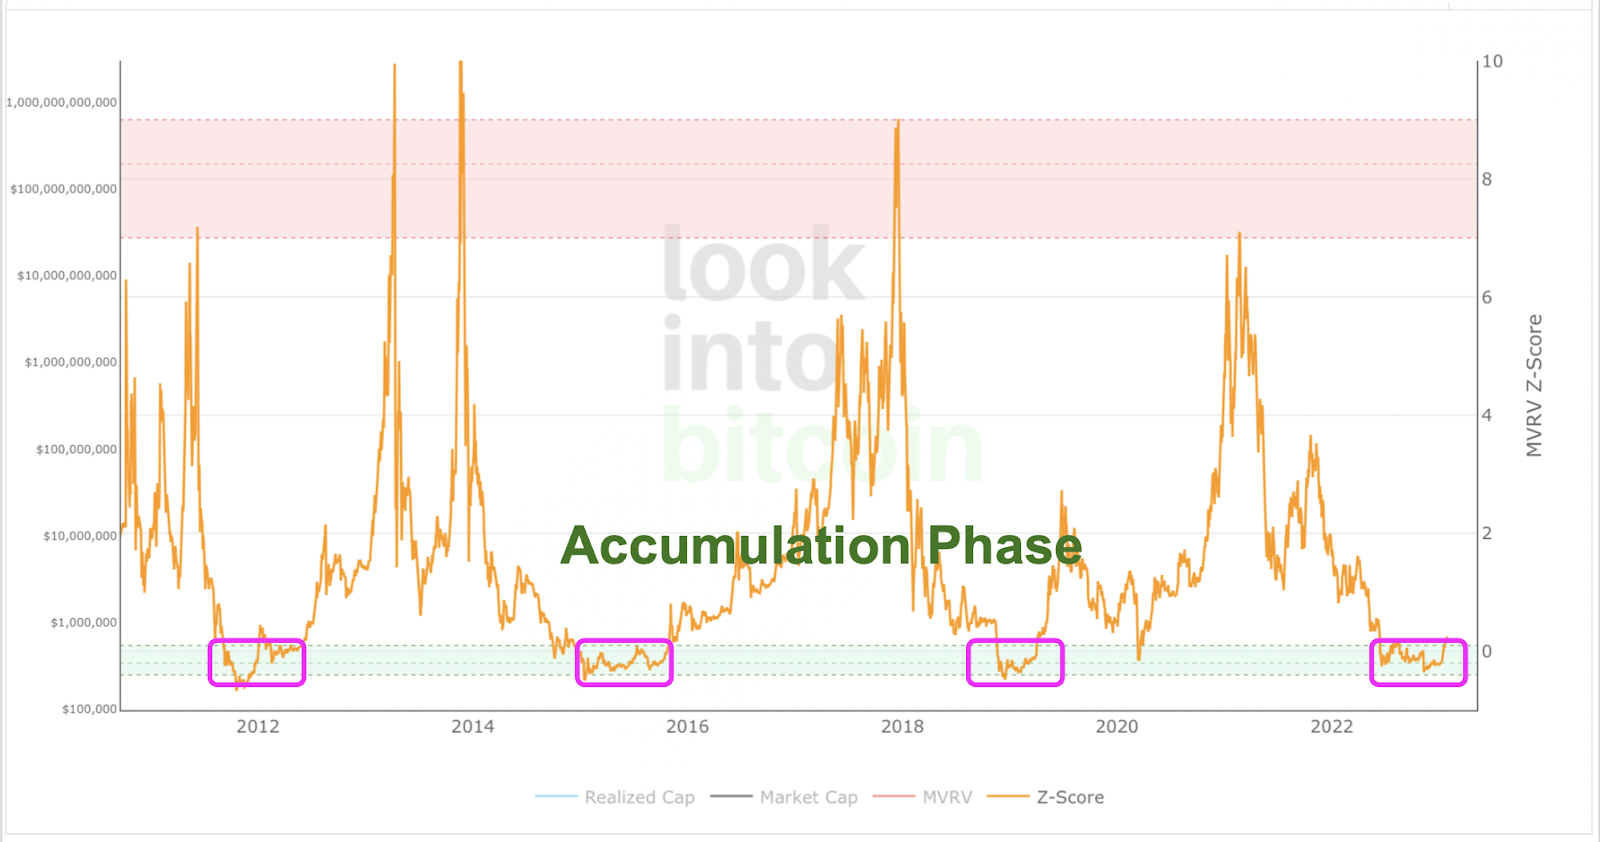
The MVRV Z-score has historically been very effective in identifying periods where market value is moving unusually high above realized value. These periods are highlighted by the z-score (red line) entering the pink box and indicating the top of market cycles. It has been able to pick the market high of each cycle within two weeks.
It also shows when market value is far below realized value, highlighted by z-score entering the green box. Buying Bitcoin during these periods has historically produced outsized returns.
Historically accumulation/bottom formation was seen when Z-Score entered the green zone.
Overall Market Performance
Dow Jones
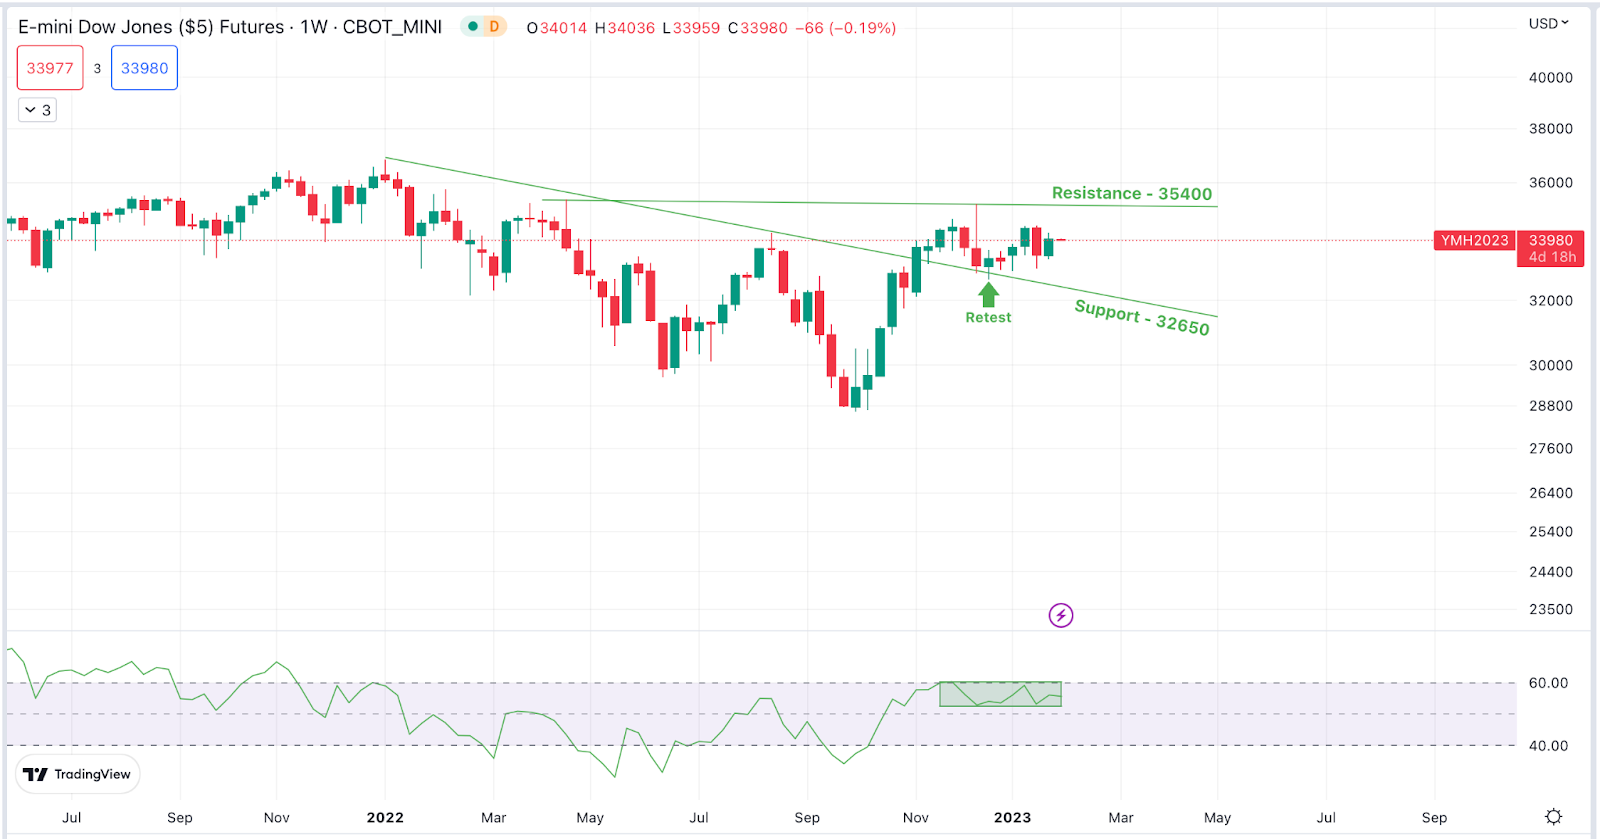
The Dow Jones Industrial Average gained by 1.71% in the last week. The next resistance is expected at 35,400 and immediate support is expected at 32,650 levels.
Gold
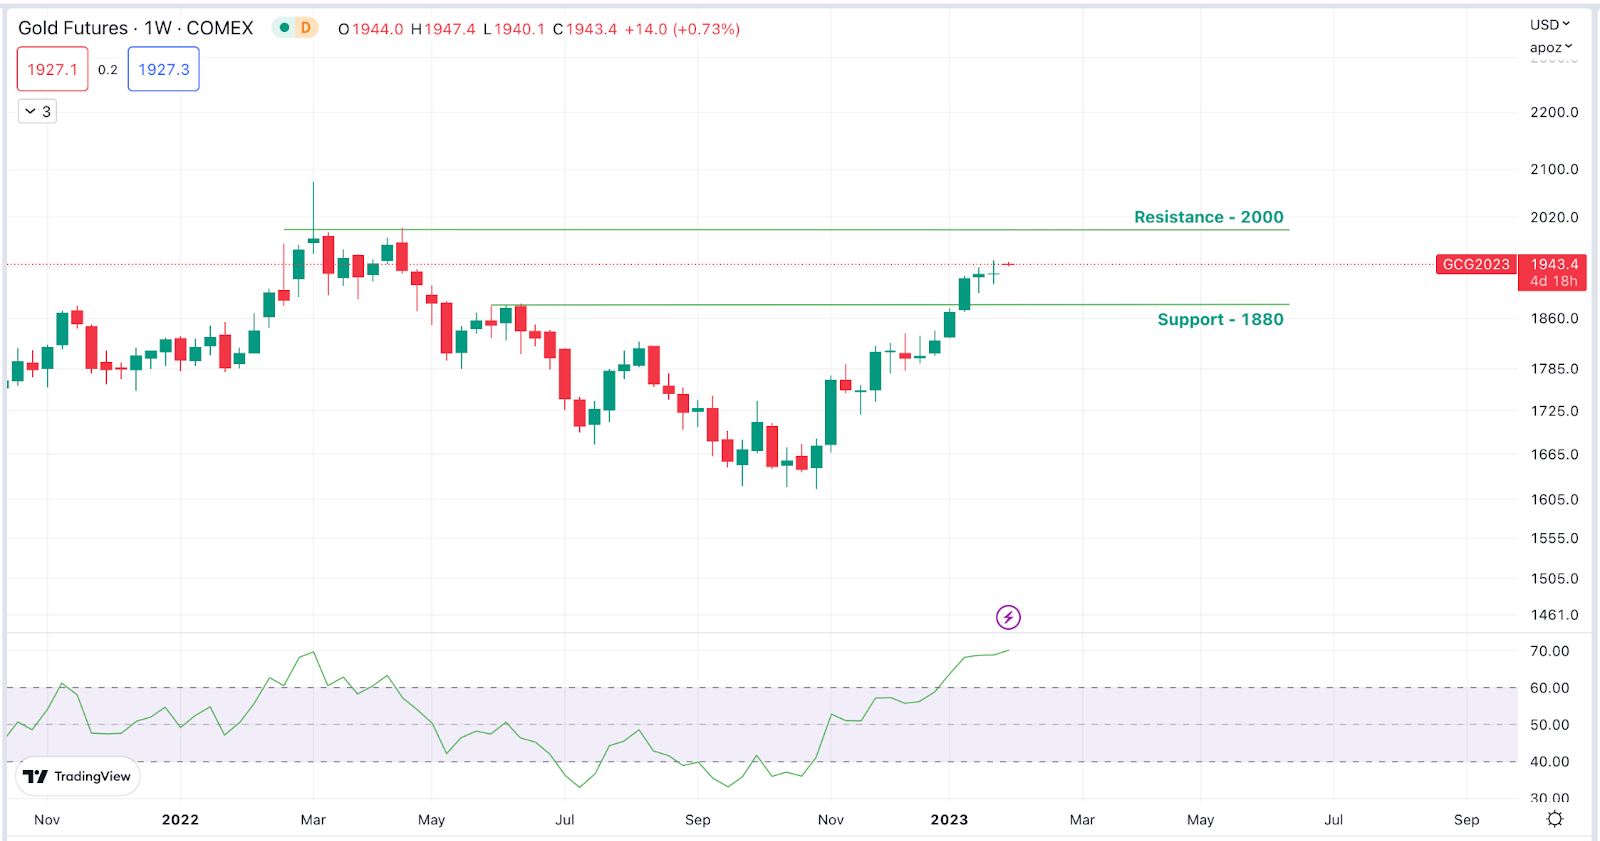
Gold Futures have formed Doji candles on a weekly time frame, sharp movement is expected. The next resistance is expected at $2,000 and immediate support is expected at $1,880
BTC/DXY
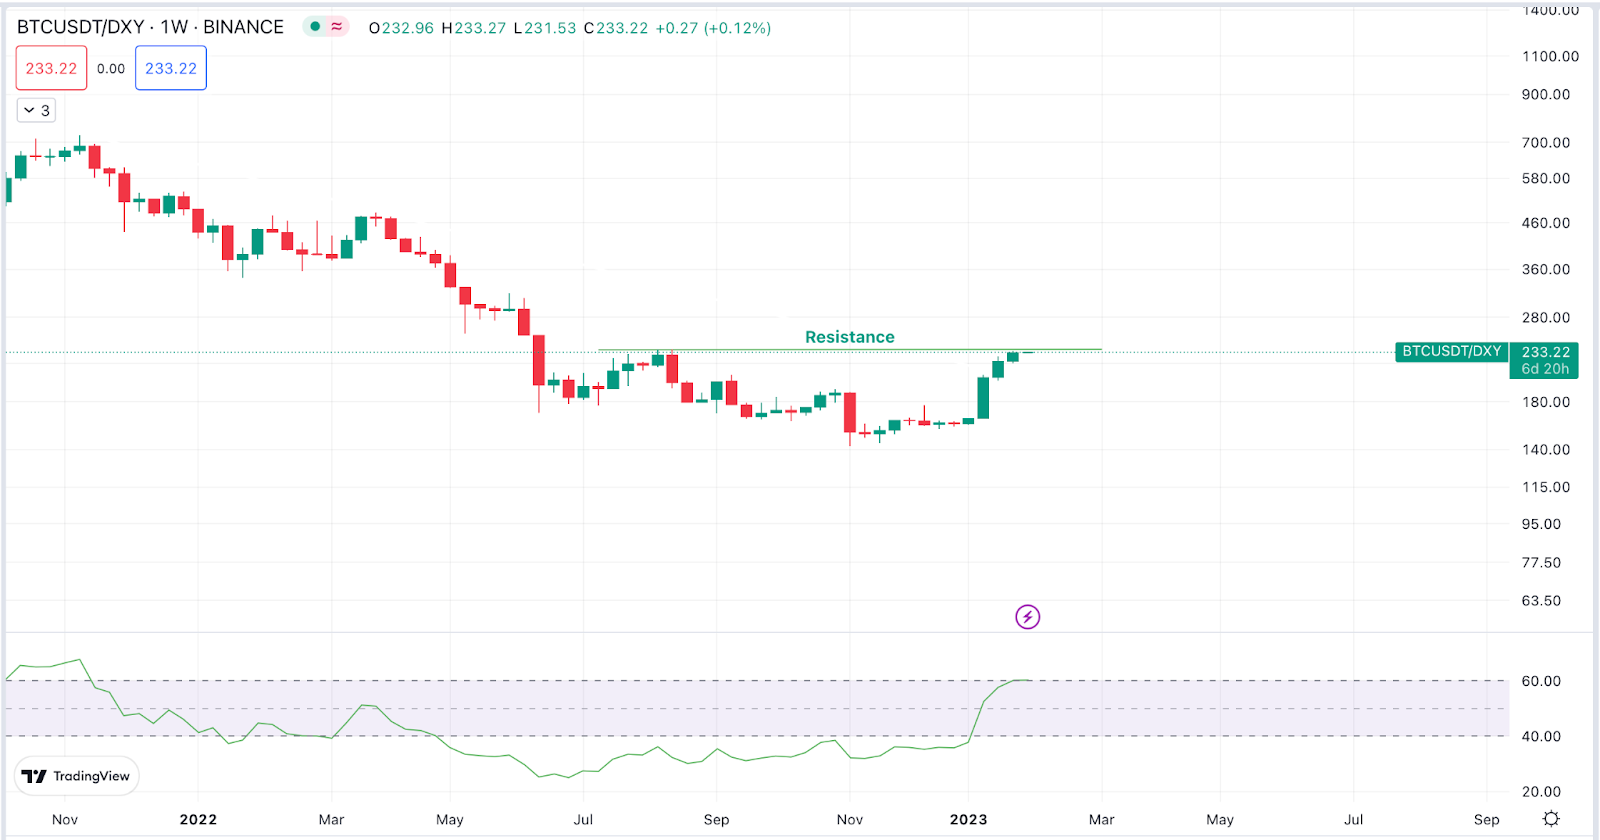
BTC/DXY has reached resistance and is expected to slow down. Bitcoin price support is expected at $21,500 and resistance is expected at $25,000
ETH/BTC
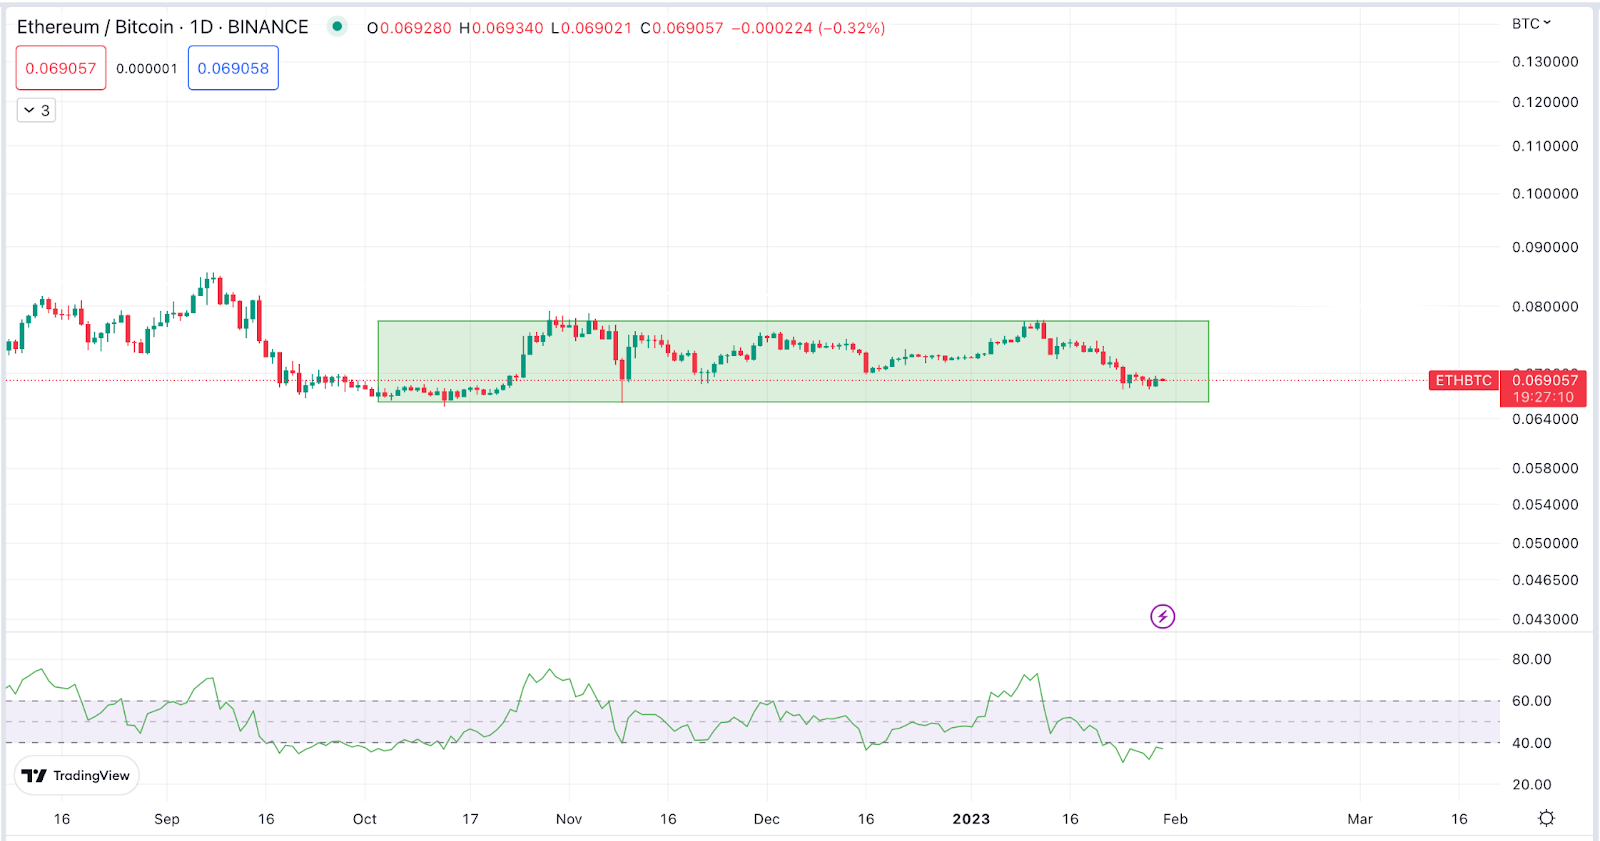
ETH/BTC is trading within the range. An immediate support is expected at 0.066 and the next resistance is expected at $0.077 levels.
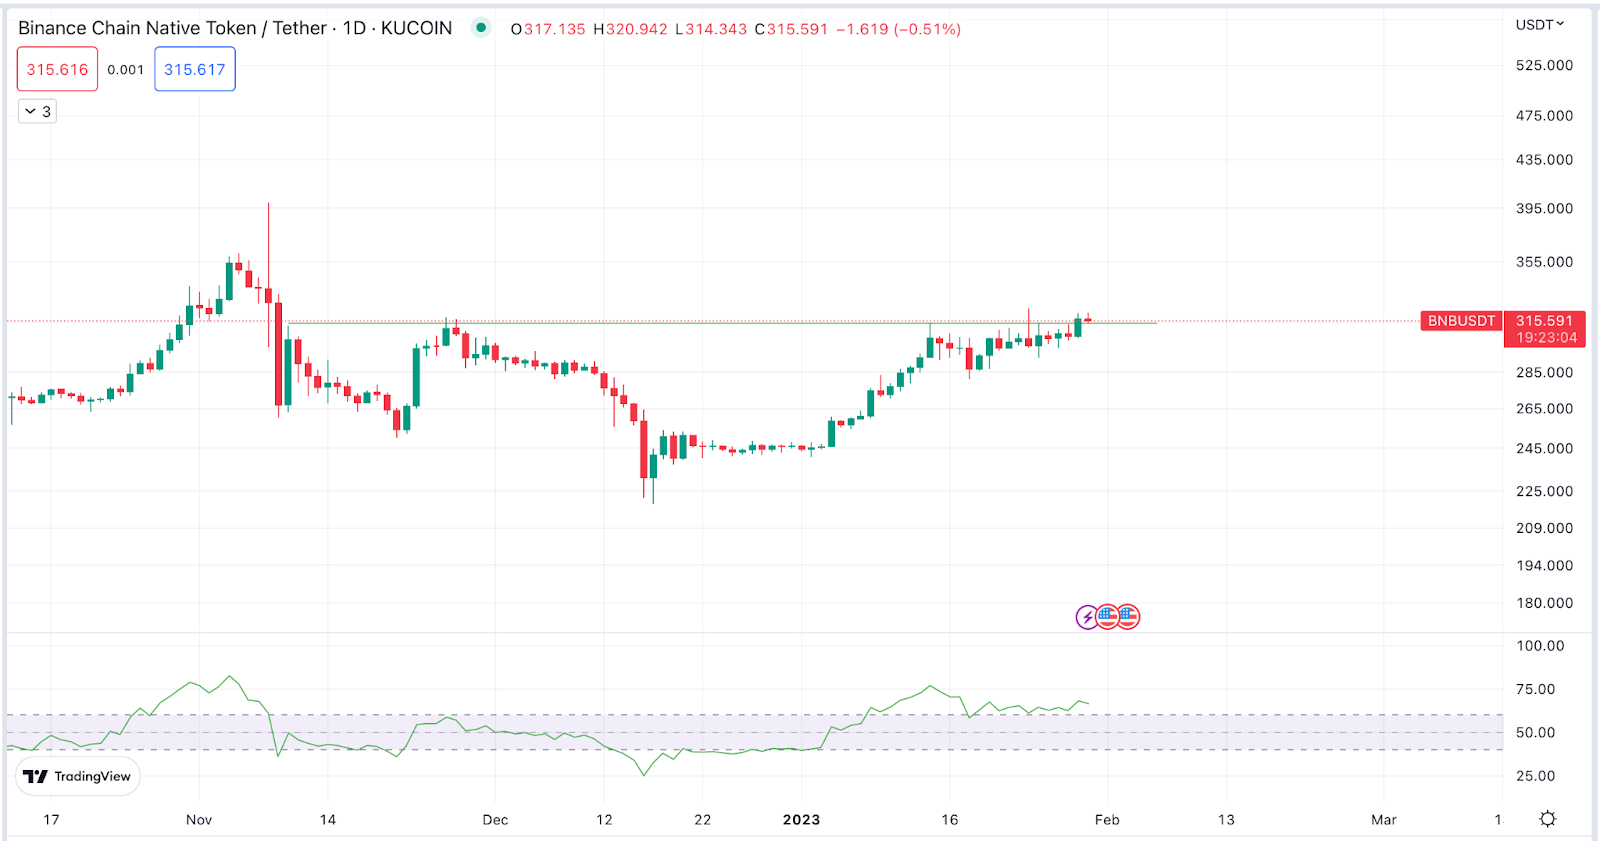
Pick of the Week – $BNB
Get deeper insights into the crypto market’s weekly trends discussed on our Spotify podcast.
Click here to Invest with Algorithms