WEEKLY CRYPTO MARKET REPORT – 15TH JAN ’23
What is the general sentiment for Crypto?
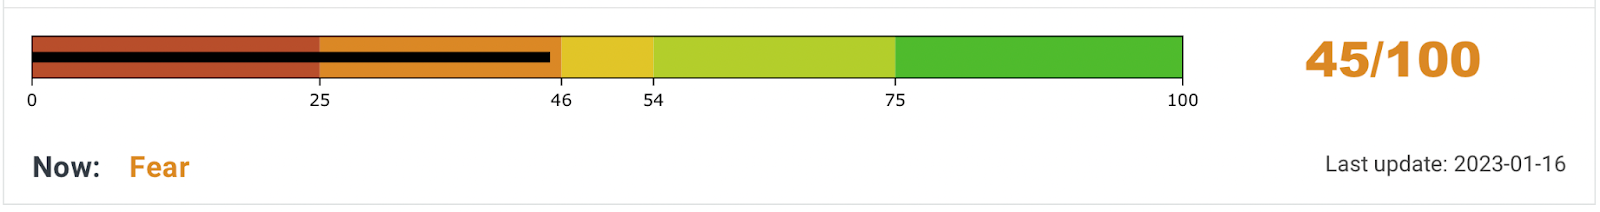
The sentiment towards the cryptocurrency market continues to remain in the Fear zone. Compared to last week’s, the Fear & Greed Index has changed from “25” to “45”.
SOPR
Another data to evaluate the sentiment of the general public would be to look at Spent Output Profit Ratio (SOPR). What is SOPR? In layman terms, it indicates if people have sold their BTC at a profit or if they sold at a loss. An SOPR value above 1 indicates that profit booking dominated loss booking and below 1 indicates that loss booking dominated profit booking. A value of 1 indicates that the coins were sold at their purchase price. Adjusted SOPR filters out transactions that are younger than 1 hour, thus, clearing out noise from the metric.
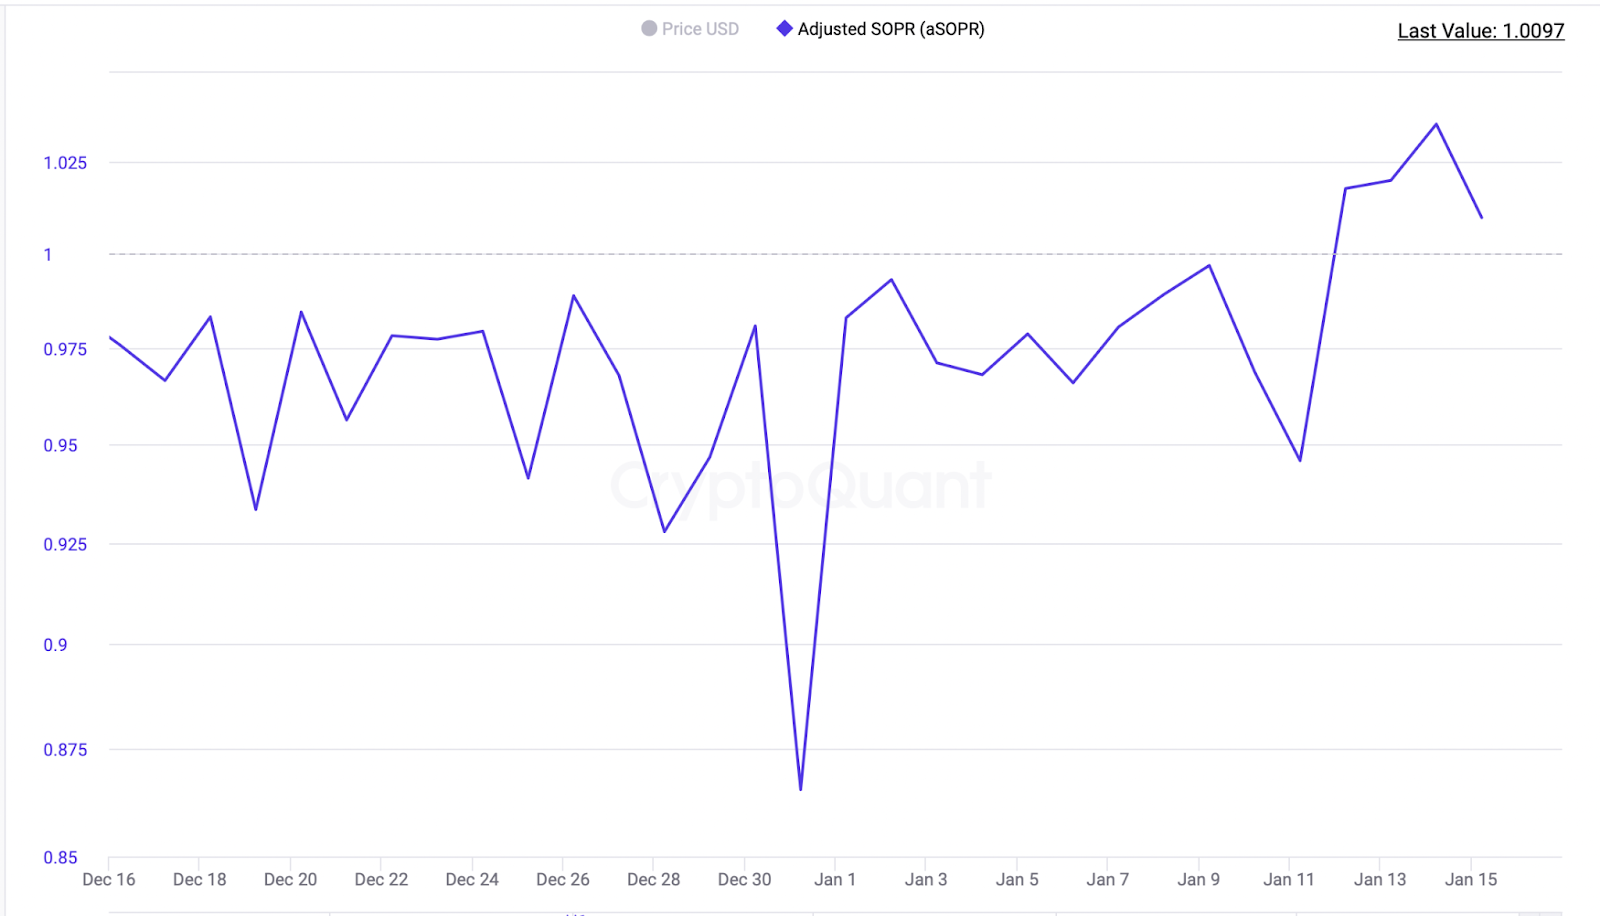
aSOPR for this week stands at 1 which means the coins were sold at their purchase price
Is This The End of the Bear Market?
CVDD-TERMINAL PRICE CHART INDICATOR
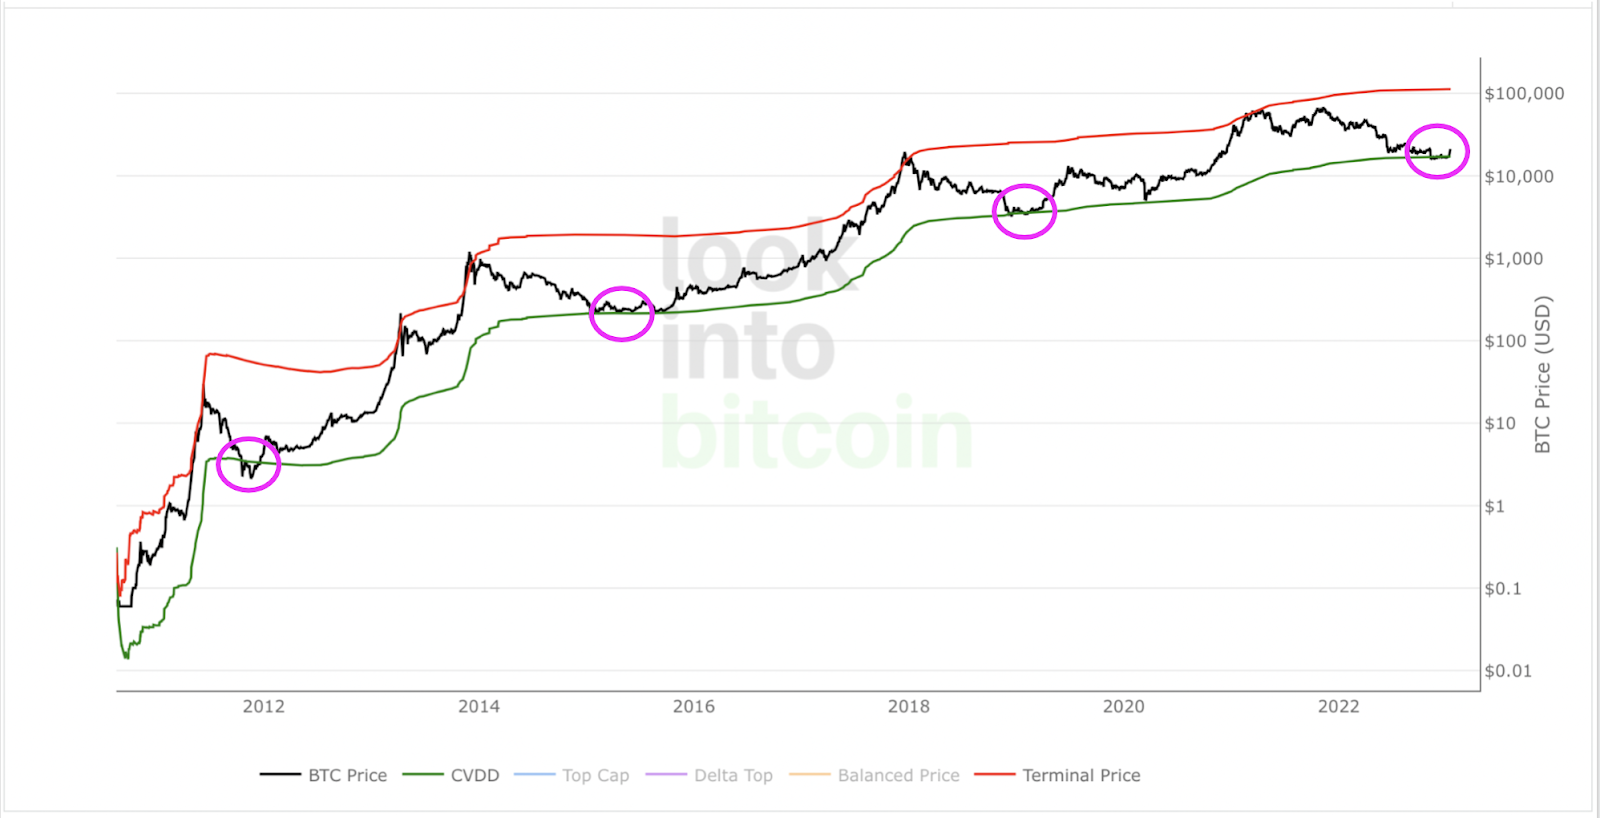
TERMINAL PRICE – This is an on-chain indicator. That means it uses data from the Bitcoin blockchain to identify actual user behavior and activity.Before Terminal price is calculated, it is first necessary to calculate Transferred Price. Transferred price takes the sum of Coin Days Destroyed and divides it by the existing supply of bitcoin and the time it has been in circulation. The value of Transferred Price is then multiplied by 21.This Terminal Price has historically been very effective at forecasting the tops of Bitcoin price cycles. Currently the TERMINAL PRICE stands at $112,422
CVDD – tracks the cumulative sum of this value-time destruction as coins move from old hands into new hands as a ratio of the market age. It is then multiplied by 6 million, which is a somewhat arbitrary number as it is not linked to any relevant Bitcoin data.
The result is that it has historically correctly forecasted the major lows of Bitcoins price with good accuracy. Currently the Bitcoin CVDD stands at $17,191 which is the long term support levels, Bitcoin Price bounced back from here as expected
REALIZED PRICE
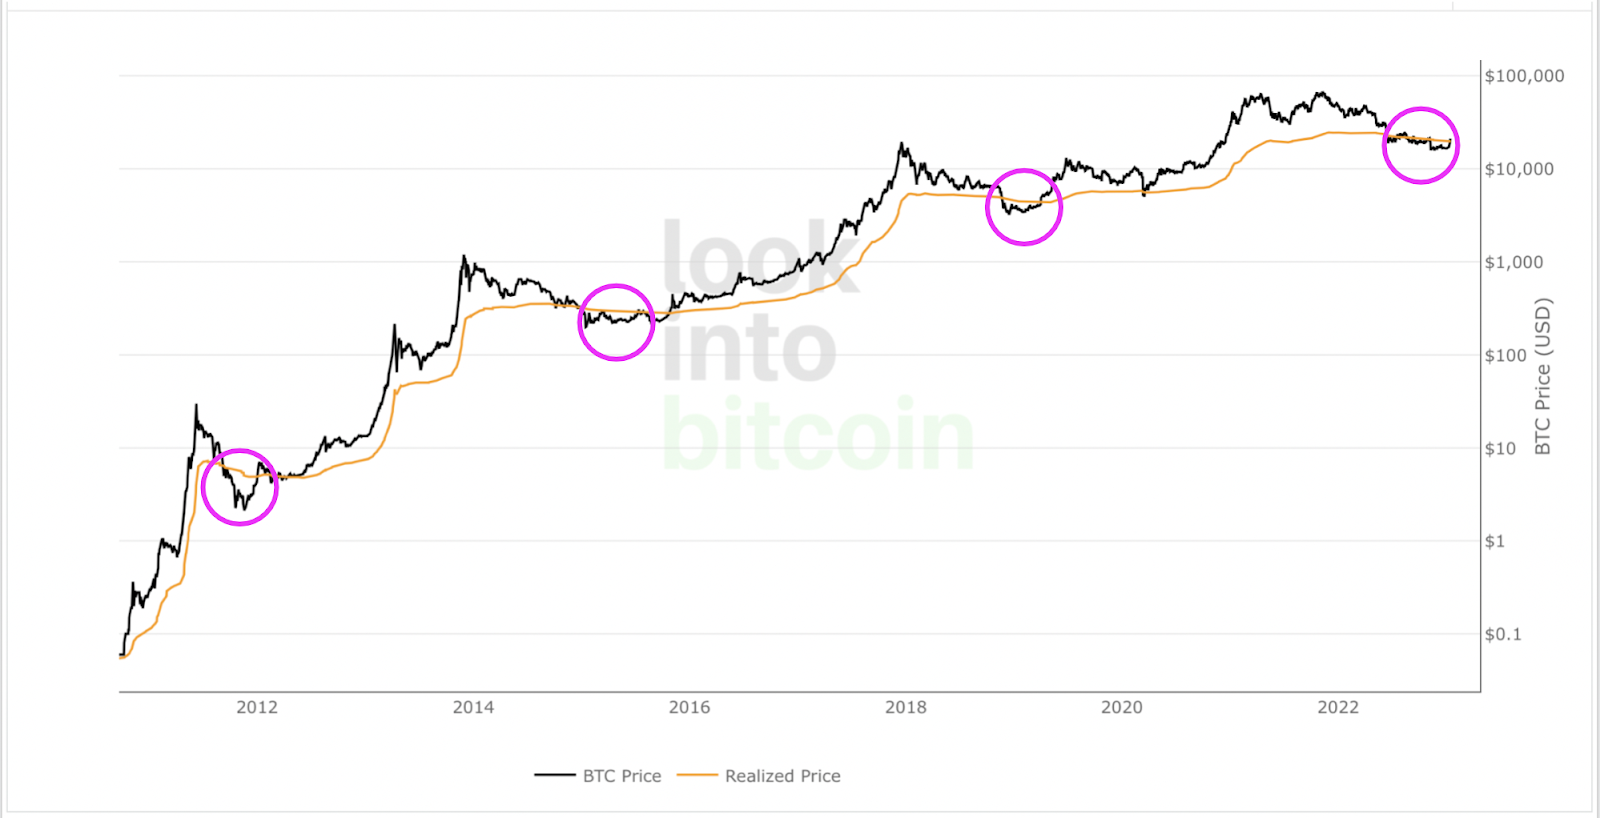
Realized price is defined as the average cost of acquisition based on every coin moved on-chain. In all the previous bear markets we see that the price trades below the realized price which indicates on average the coins held during this period have higher cost of acquisition than the current market price. Realized prices act as psychological support areas during bear markets.
How Is Realized Price Useful For Bitcoin Investors?
It is a useful metric because it can show when the market is under a period of distress. That is when the current Market Price drops below Realized Price, meaning that on aggregate Bitcoin holders are holding onto paper losses.
Historically, these periods have occurred at major cycle lows. This can be seen on the free Bitcoin live chart above.
The reason why this phenomenon happens is that many participants are not comfortable holding onto a losing position, fearing that their losses may increase. Particularly in a bear market when news and media about Bitcoin are very negative. They end up selling to value investors at the market cycle lows before $BTC Market Price eventually moves back up above Realized Price as it enters a bull market phase. This has historically held true as Bitcoin has continued to move through its adoption cycle.
The current price of Bitcoin is trading above the realized price of Bitcoin of 19,750 USD. The market price of Bitcoin trading above realized price is an indication of upward movement in the price
MVRV Z-SCORE
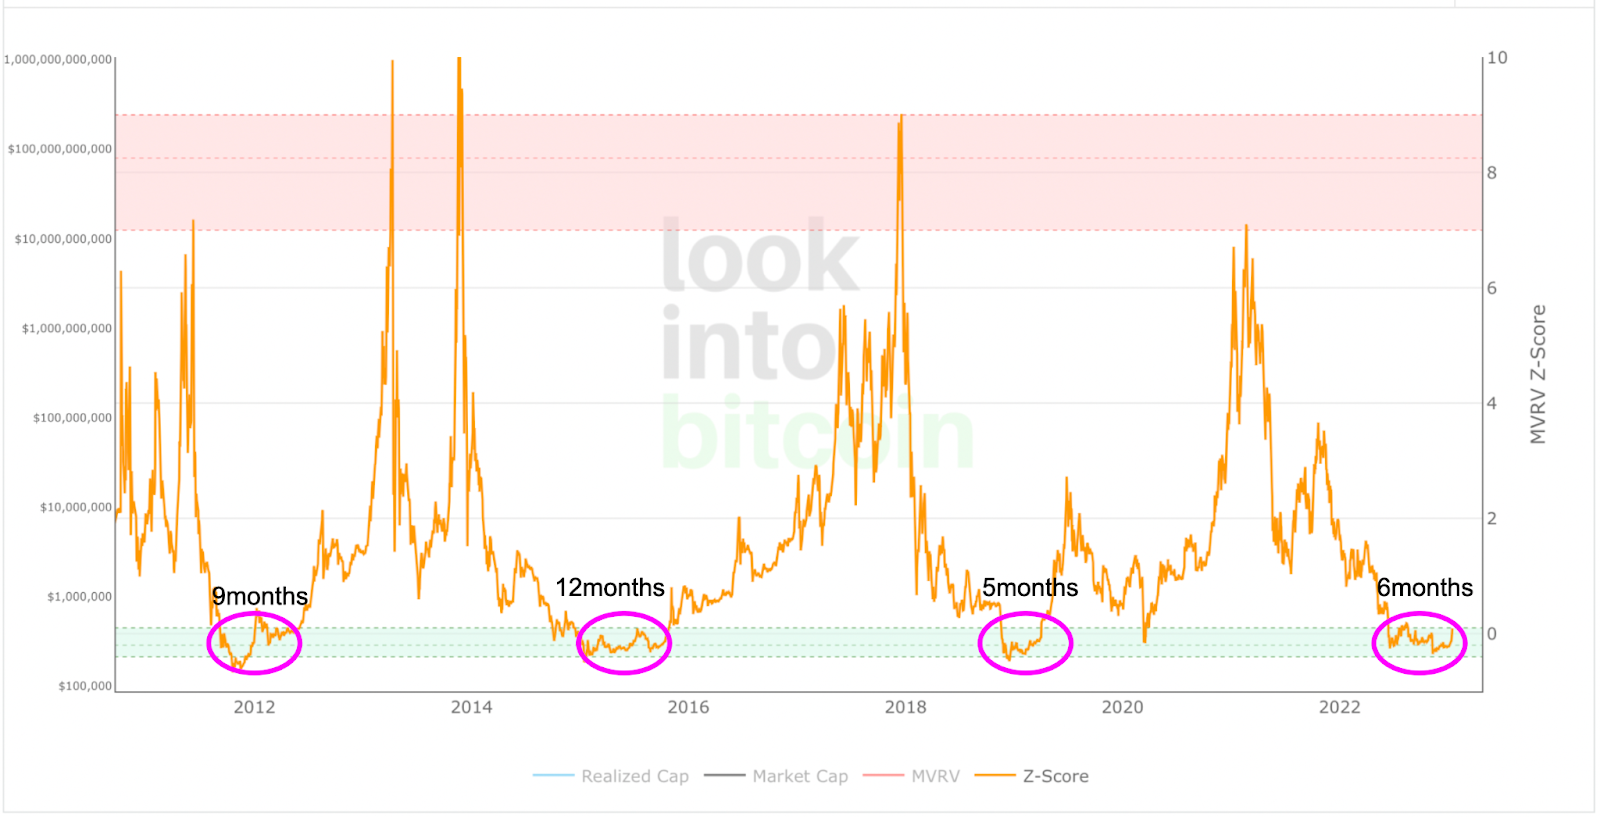
The MVRV Z-score has historically been very effective in identifying periods where market value is moving unusually high above realized value. These periods are highlighted by the z-score (red line) entering the pink box and indicating the top of market cycles. It has been able to pick the market high of each cycle within two weeks.
It also shows when market value is far below realized value, highlighted by z-score entering the green box. Buying Bitcoin during these periods has historically produced outsized returns.
Overall Market Performance
Dow Jones
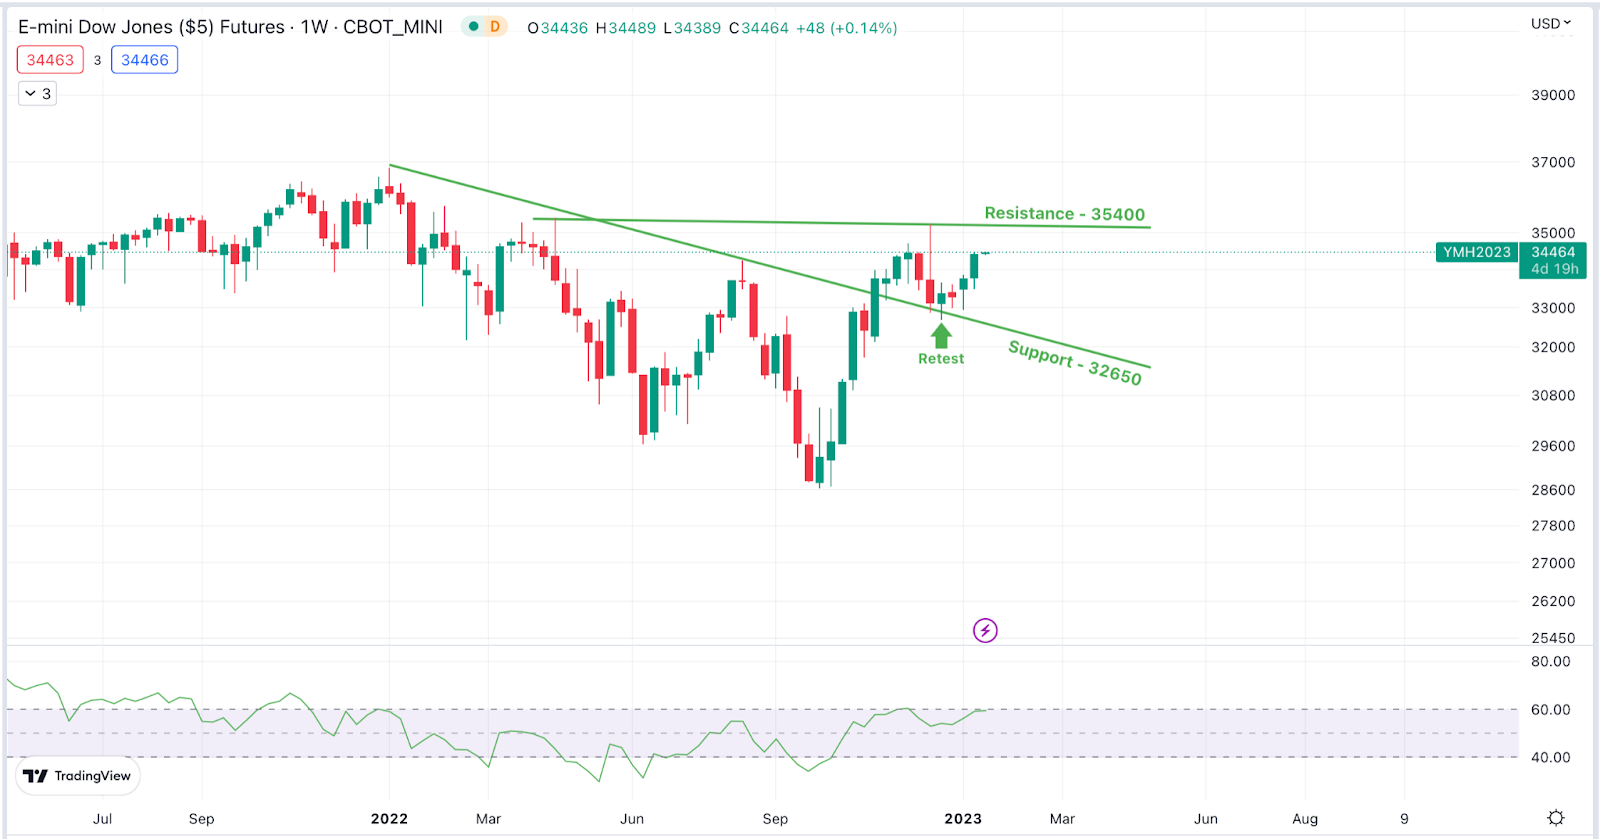
The Dow Jones Industrial Average gained 1.91% in the last week. The next resistance is expected at 35,400 and immediate support is expected at 32,650 levels.
Gold
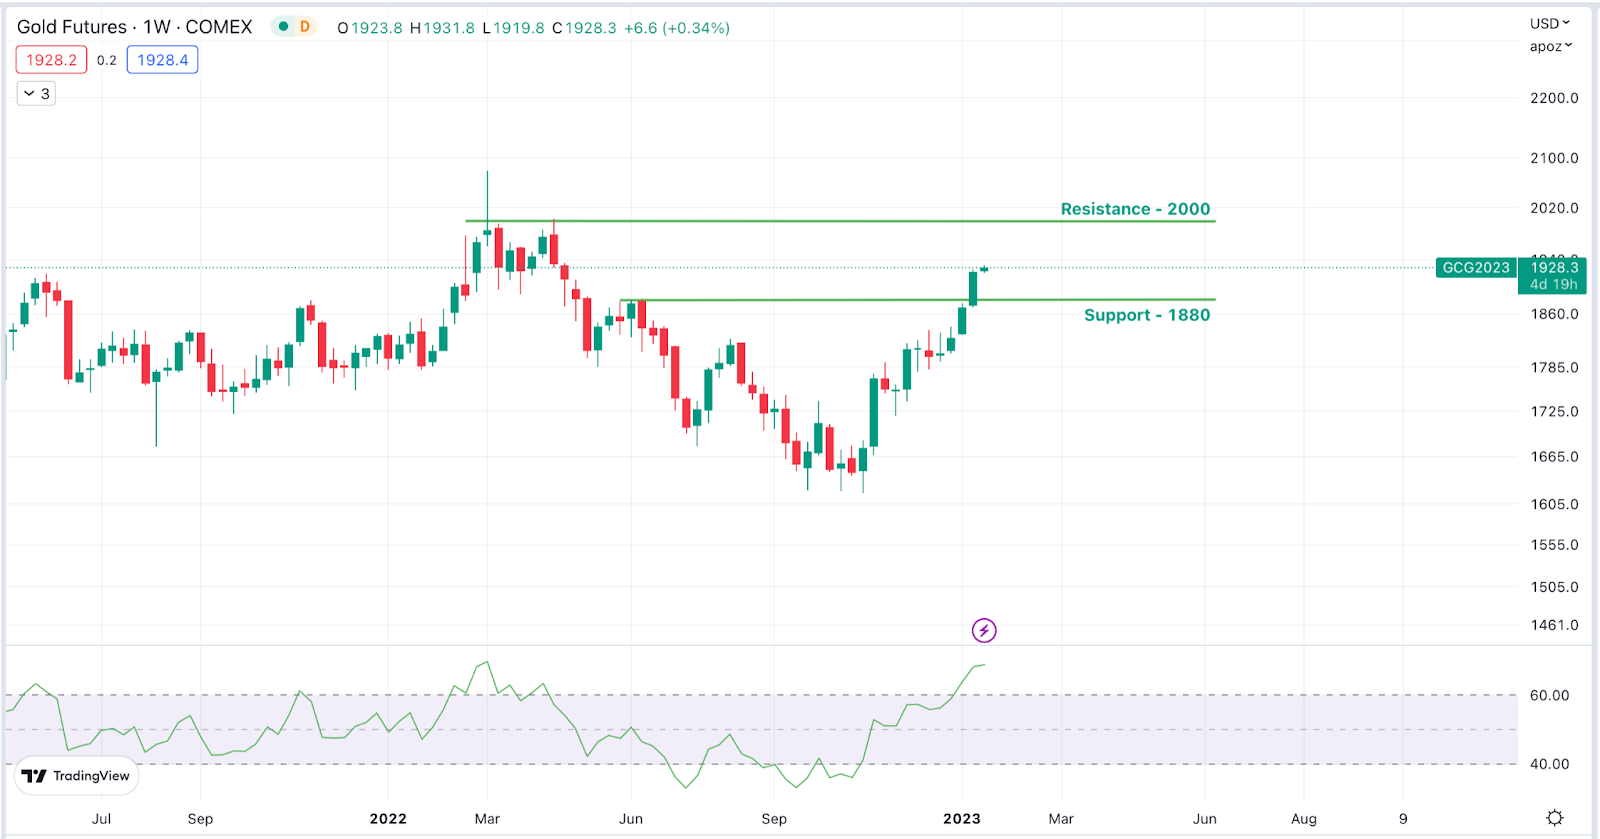
Gold Futures broke out of Inverted head and shoulder pattern, upside movement is expected. The next resistance is expected at $2,000 and immediate support is expected at $1,880
Bitcoin
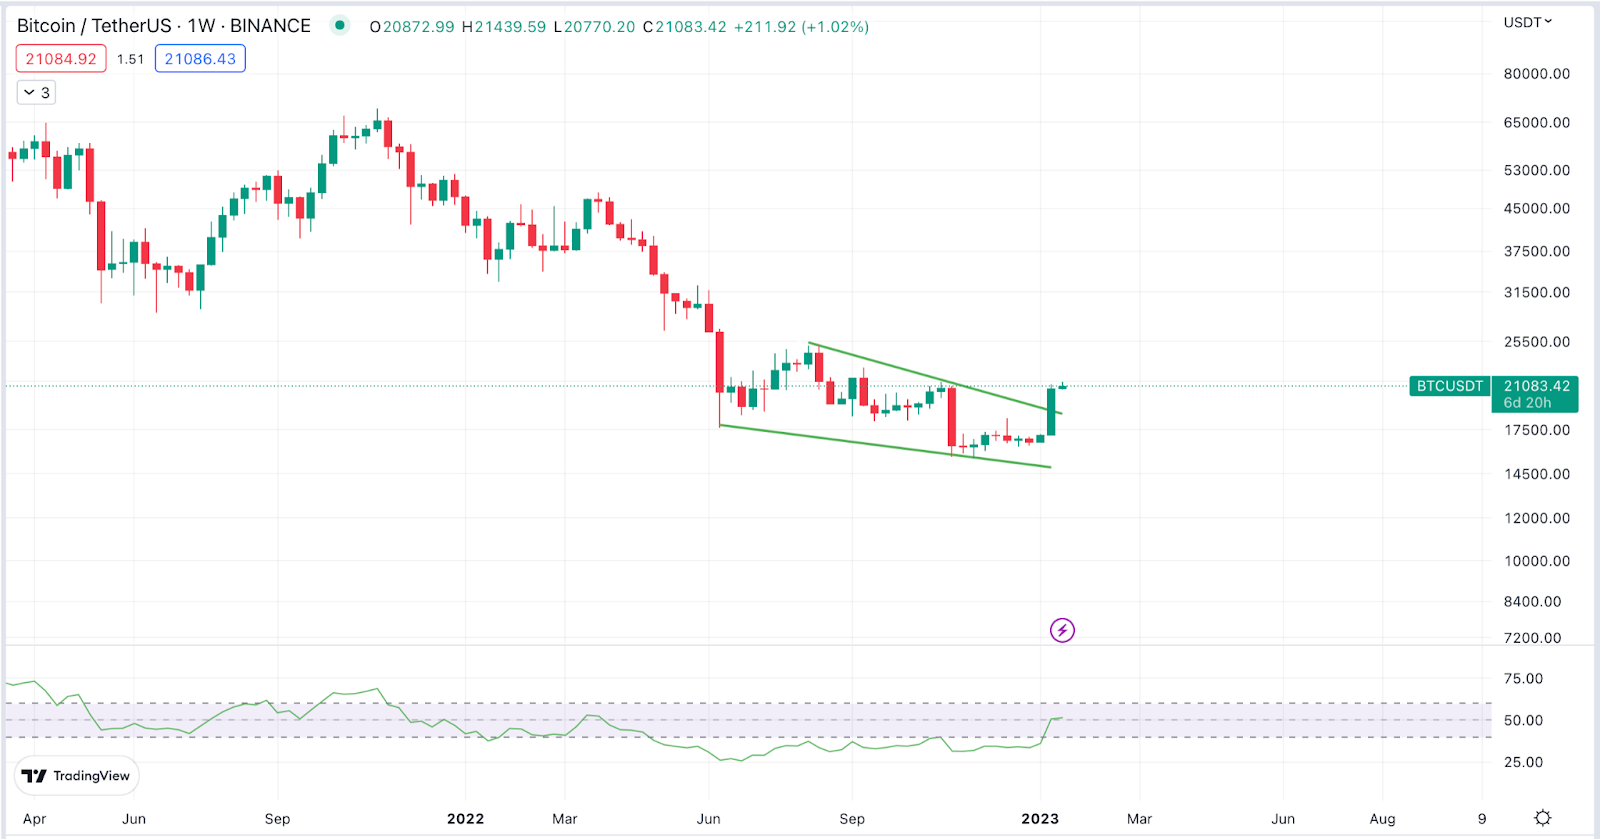
Bitcoin has broken out of the descending triangle pattern, upside movement is expected. The next resistance is expected at $21,500 and support at $18,000
ETHEREUM
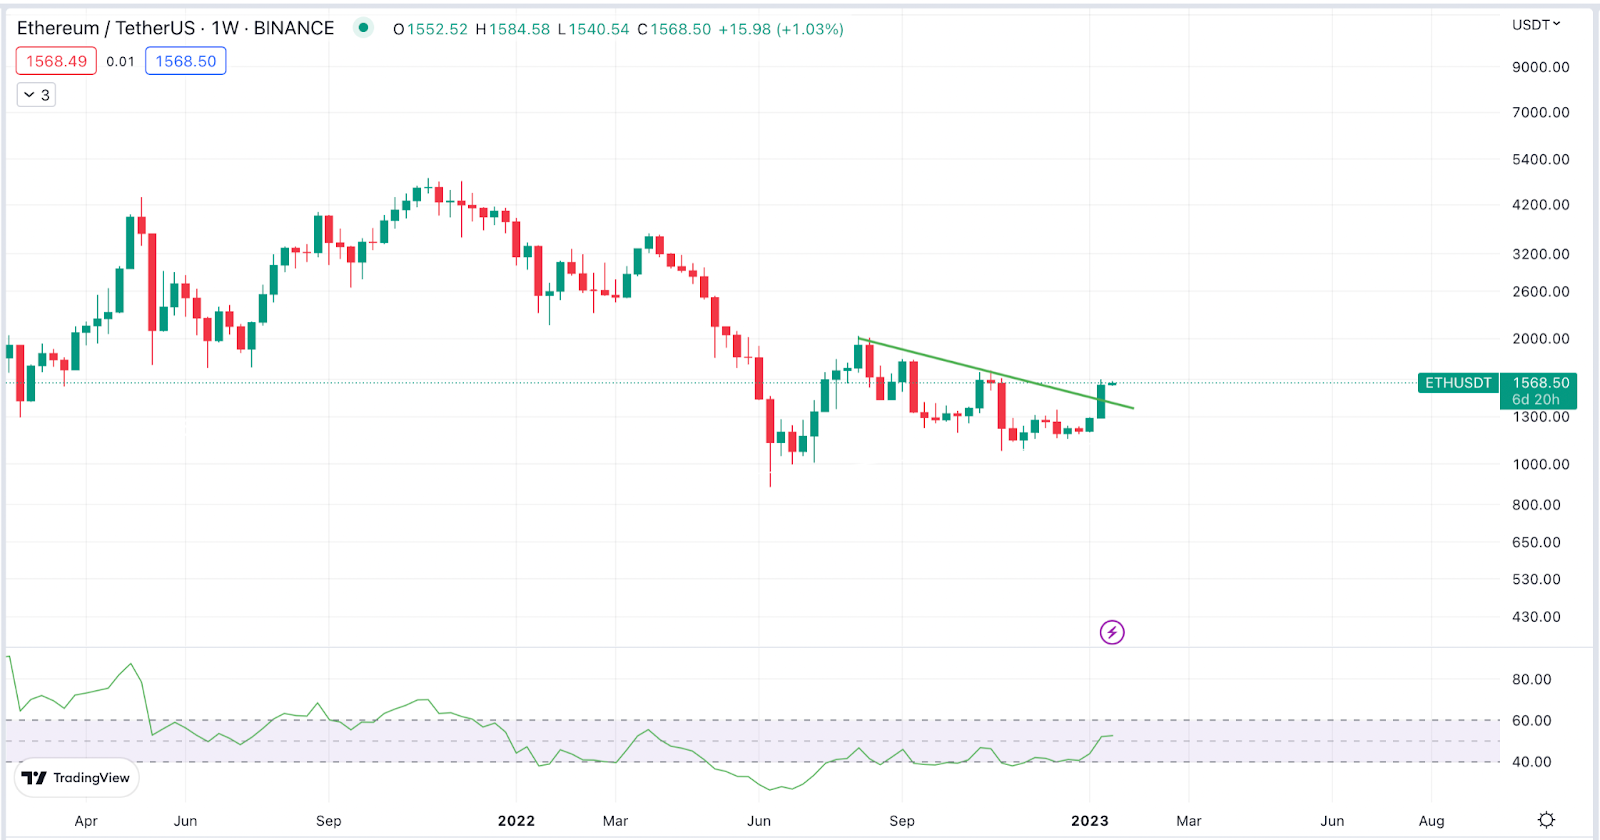
ETH broke out of a 3 month consolidation, upside movement is expected. An immediate support is expected at 1350 and the next resistance is expected at 1700 levels.
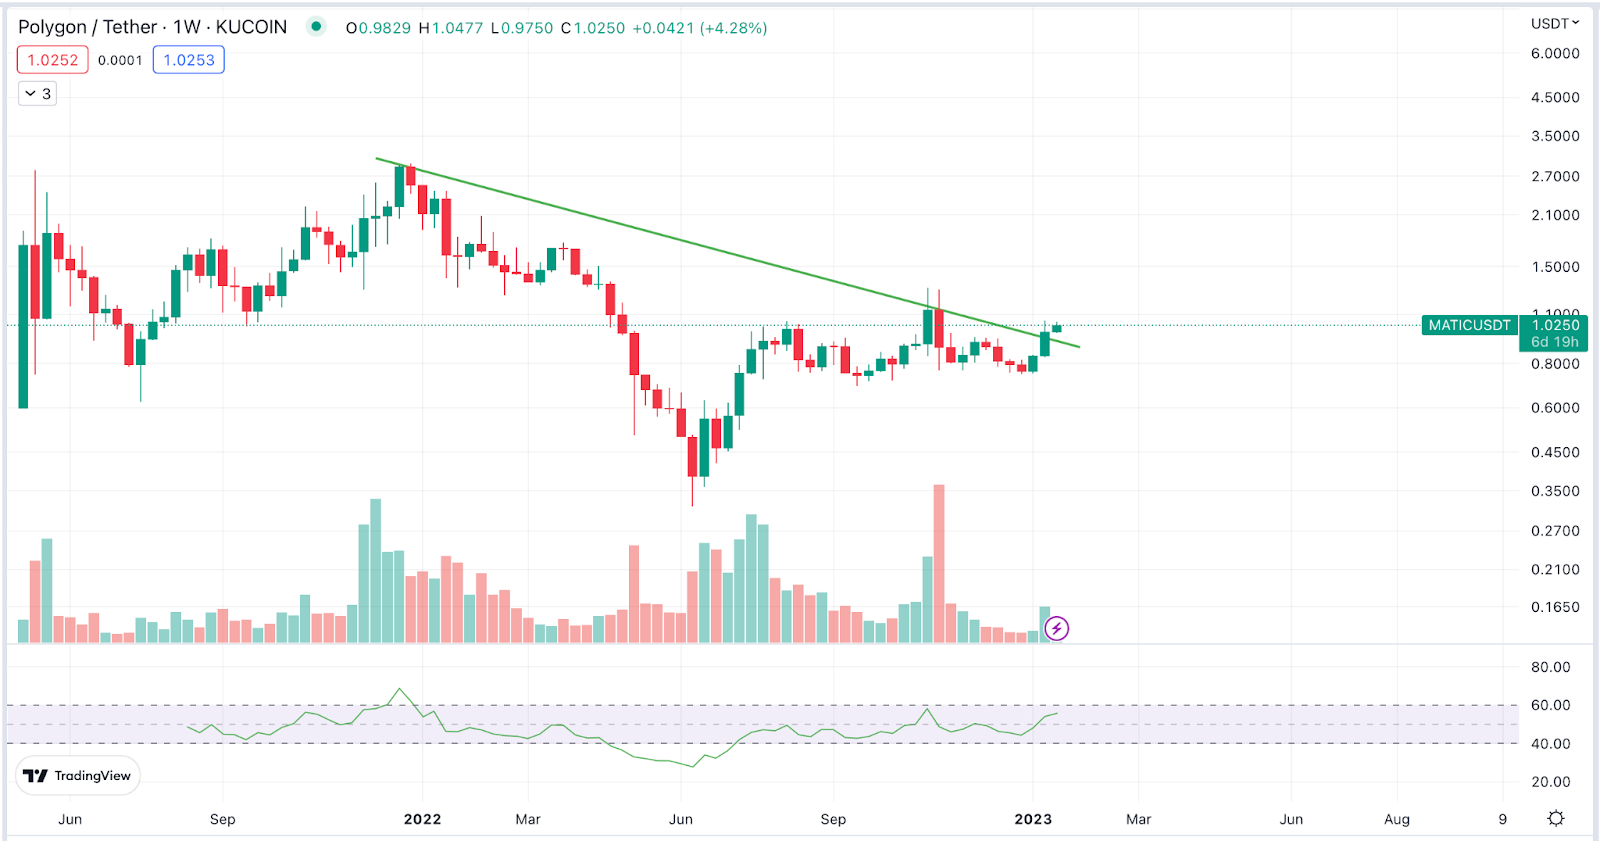
Pick of the Week – $MATIC
Get deeper insights into the crypto market’s weekly trends discussed on our Spotify podcast.
Start your Crypto Investments with XMINT Bots today