Crypto Market Dominance
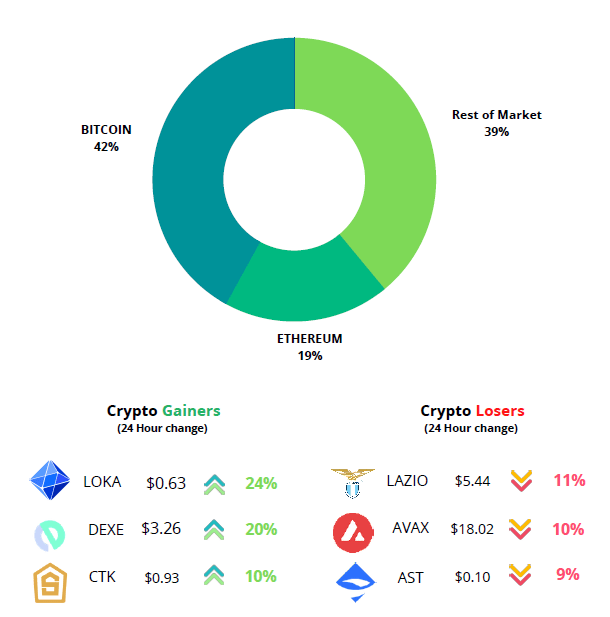
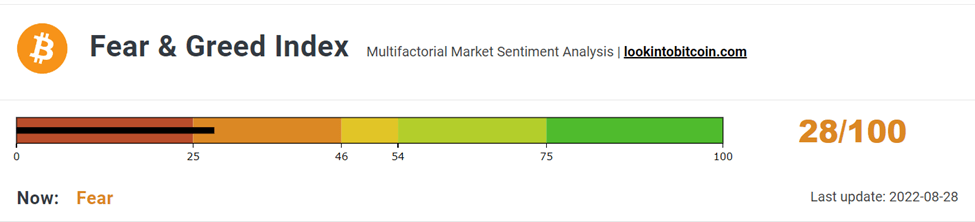
What is the general sentiment for Crypto?
The sentiment towards the cryptocurrency market is in the fear zone and compared to last week’s, the Fear & Greed Index has not changed significantly and currently stands at “28”.
Another data to evaluate the sentiment of the general public would be to look at Spent Output Profit Ratio (SOPR). What is SOPR? In laymen terms, it indicates if people have sold at a profit or if they sold at a loss. An SOPR value above 1 indicates that profit booking dominated loss booking and below 1 indicates that loss booking dominated profit booking. A value of 1 indicates that the coins were sold at their purchase price. Adjusted SOPR filters out transactions that are younger than 1 hour, thus, clearing out noise from the metric.
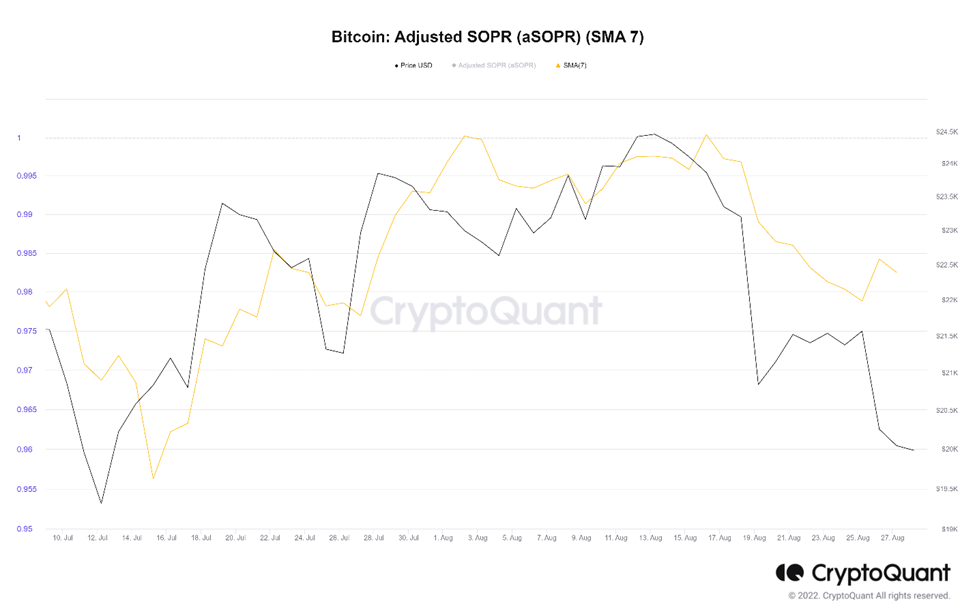
aSOPR for this week stands at 0.98 which means the coins are being sold near their purchase price. For trend reverval the metric should stay and oscillate above 1.
Where Are We In The Bear Market?
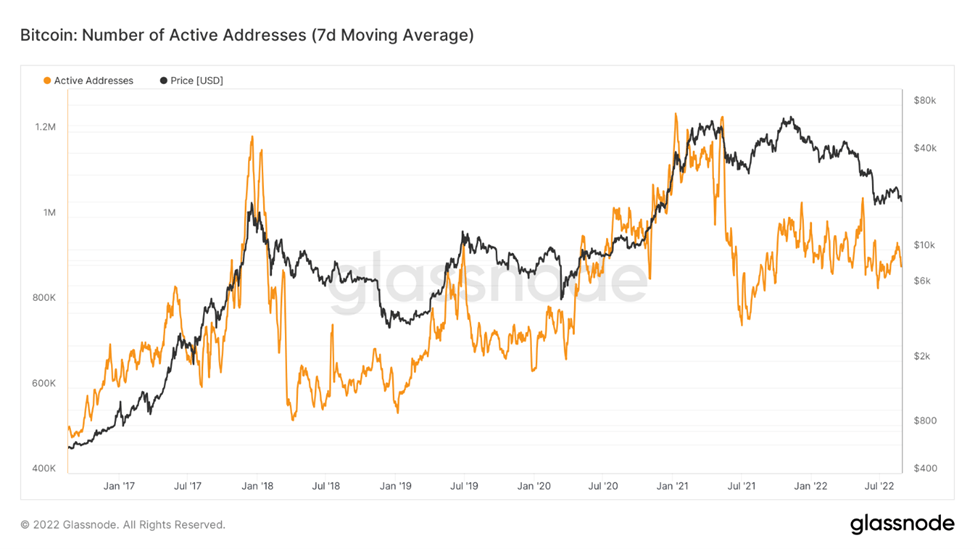
The number of active addresses is directly proportional to the number of active users. It is important to note that the number of active addresses doesn’t give the exact number of active users as a user might have more than one address.
During a bull market, the number of active addresses increases tremendously and a sharp fall is experienced as prices begin to fall showing weaker hands leaving the market. Historically, we have seen the metric startes oscillating within a range after the fall in the bear market and increases sharply as the market prepares to move out of the bear phase. In the current market, the metric is moving sideways showing that the market is sustained by the hodlers. We might see massive price movement once the metrics start making higher highs.
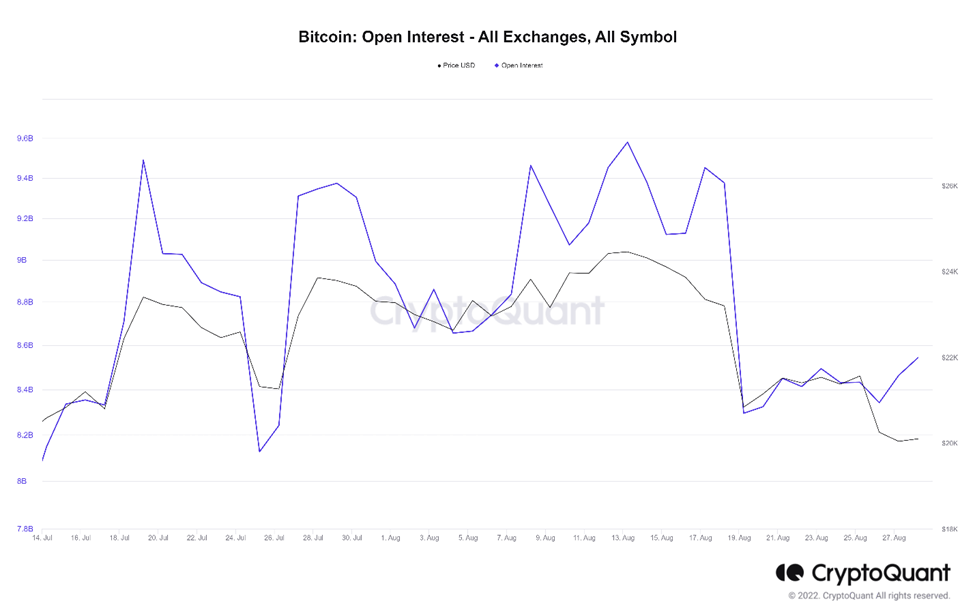
Open Interest (OI) is defined as the number of open positions which includes both long and short positions. An increase in OI means more contracts are being opened which indicates more liquidity, volatility, and attention coming into the derivative market whereas decrease in OI indicates less number of future contract or positions which might trigger short/long squeeze.
Compared to last week, OI has not changed significantly but the price of BTC has fallen by more than 10%. The decerase in price is not supported by the open interest.
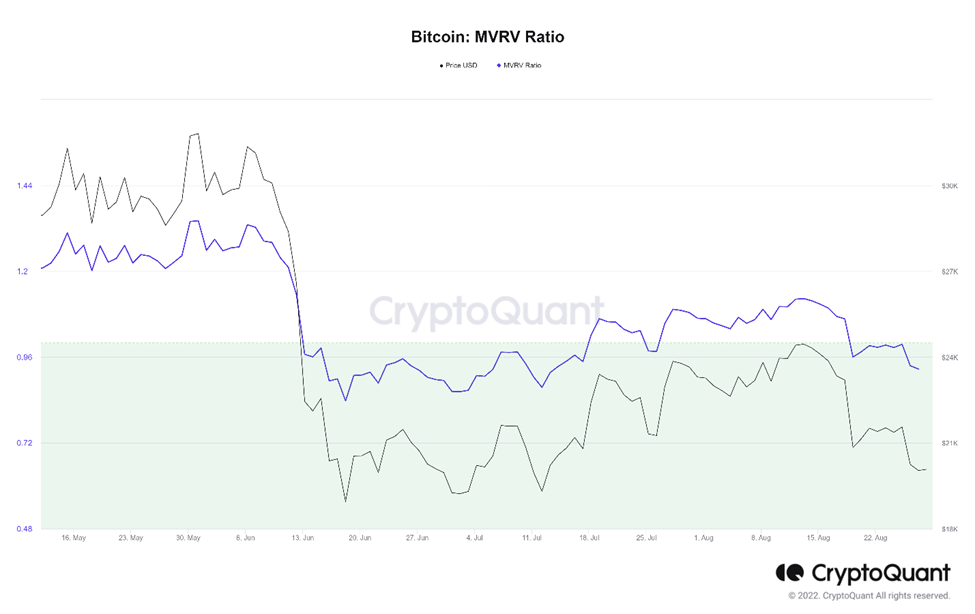
MVRV ratio is equal to the market capital divided by realized capital of Bitcoin. Realized capital unlike market capital does not use the current market price, but rather uses the prices of each Bitcoin when they last moved.
So, for example if the price of most of the Bitcoin when they last moved was $10,000 and the current price is $60,000. Then the MVRV ratio would stand at 6. This means that the market is extremely heated and profit booking is likely. On the other hand, if the of most of the Bitcoin when they last moved was near the market price, then the CMP can be considered as the bottom.
Currently, the metric stands at 0.92. In the previous bear markets, we have seen that the metric falls below 1 and oscillates below 1 for few days or months which mark the bottom of the bear market. As the metric moves above 1, the trend reverses. After staying above 1 for almost a month, the metric has fallen below 1 due to recent drop in price.
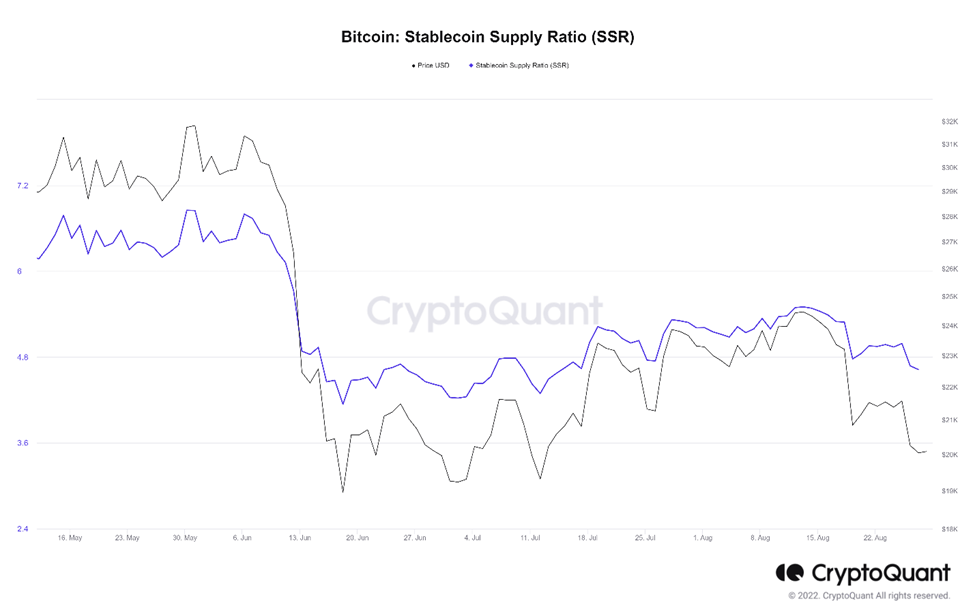
Stablecoin Supply Ratio (SSR) is the ratio of market cap of BTC divided by the market cap of all stablecoins.
- Low SSR value indicates high Stablecoin Supply compared to that of BTC market cap indicating potential buying pressure and possible price rise.
- High SSR value indicates low Stablecoin supply compared to the market cap of BTC indicating potential selling pressure and possible price fall.
After SSR made its bottom in June, the metric had been making an upward movement for the past 2 years. The recent price drop has led to the drop in the metric from 5.5 to 4.6.
Overall Market Performance
Dow Jones
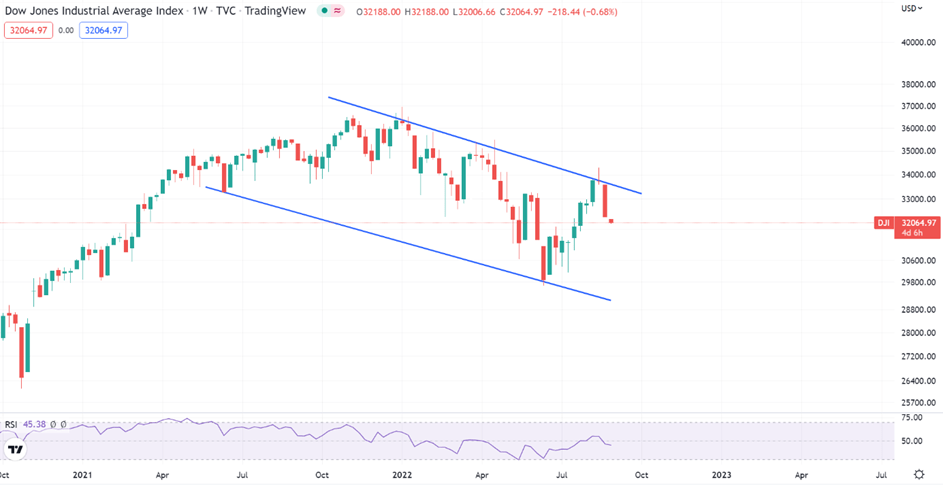
Dow Jones Industrial Average dropped over 4% in the last week as the Dollar index strengthened. The weekly trend for Dow Jones is traversing within a descending channel pattern and is retesting the upper trendline. The next support is expected at 29,600 level.
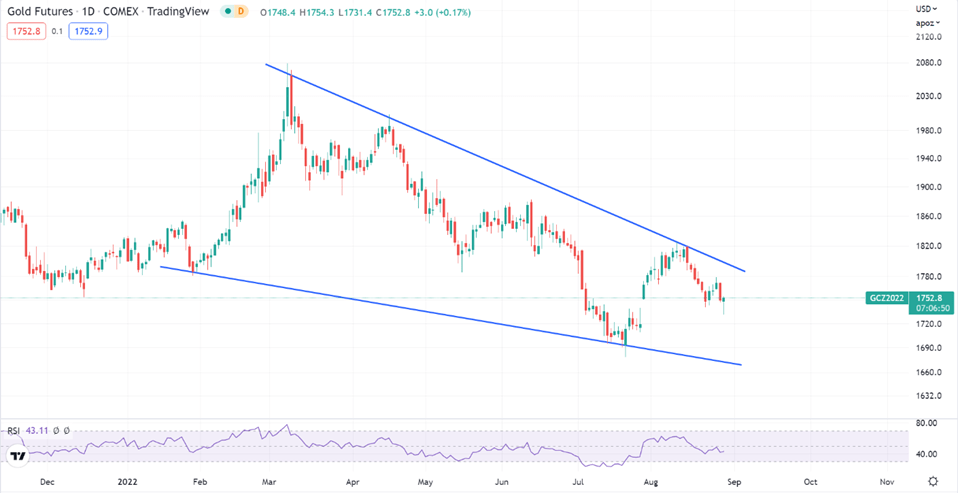
Gold
Gold Futures dipped by nearly 1% level last week. The daily trend for Gold is moving withing the descending triangle pattern. The next resistance for Gold is expected at $1,840 and next support is expected at $1,680
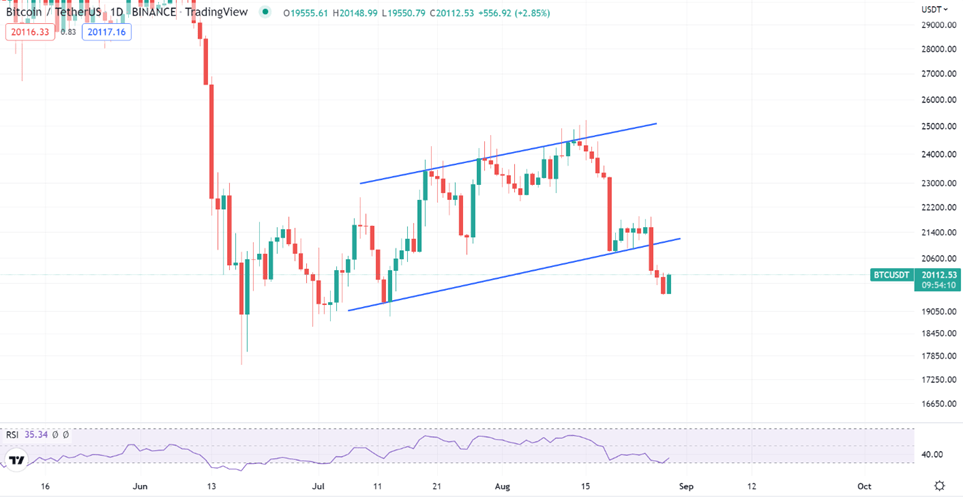
Bitcoin
Bitcoin dropped over 9% in the past week as the Dollar index strengthened. The daily trend for BTC has broken below the ascending channel pattern. The next resistance is expected at $32.3K and key support is expected at $19K.
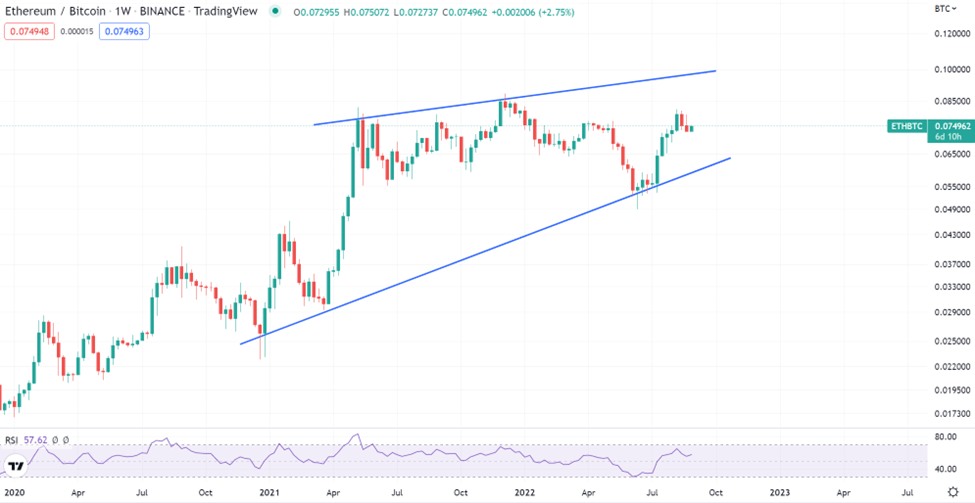
ETHEREUM
Ethereum against BTC weakened during the week, falling by 3%. The weekly trend for ETH-BTC is moving within an ascending triangle pattern. The next resistance is expected at 0.088.
Highlights of the week

Polygon co-founder Sandeep Nailwal has raised $50 million
for a new startup fund dedicated to Web3 companies & it
has already invested in blockchain-focused gaming startups:
BlinkMoon, Planet Mojo and Community Gaming.

The $74 million plan by two former Uniswap Lab executives
for a new Uniswap Foundation has just become reality after
their proposal received over 99% of the votes from UNI
token holders. The foundation aims to streamline Uniswap’s
Grant Program (UPG) and reduce friction in the protocol’s
governance system.

Beijing Municipality announced an action plan that demands
various districts build technological infrastructure at a city
level and promote its use in various fields, including
education and tourism.
Our Pick of the Week
Polygon (MATIC)

We expect a gain of 10% from the Buy Price of 0.8159 USDT and
outperform BTC in the coming week.
Get deeper insights into the crypto market’s weekly trends discussed on our Spotify podcast.
Start your Crypto Investments with XMINT Bots today