WEEKLY CRYPTO MARKET REPORT
NASDAQ – Global leading Tech Index
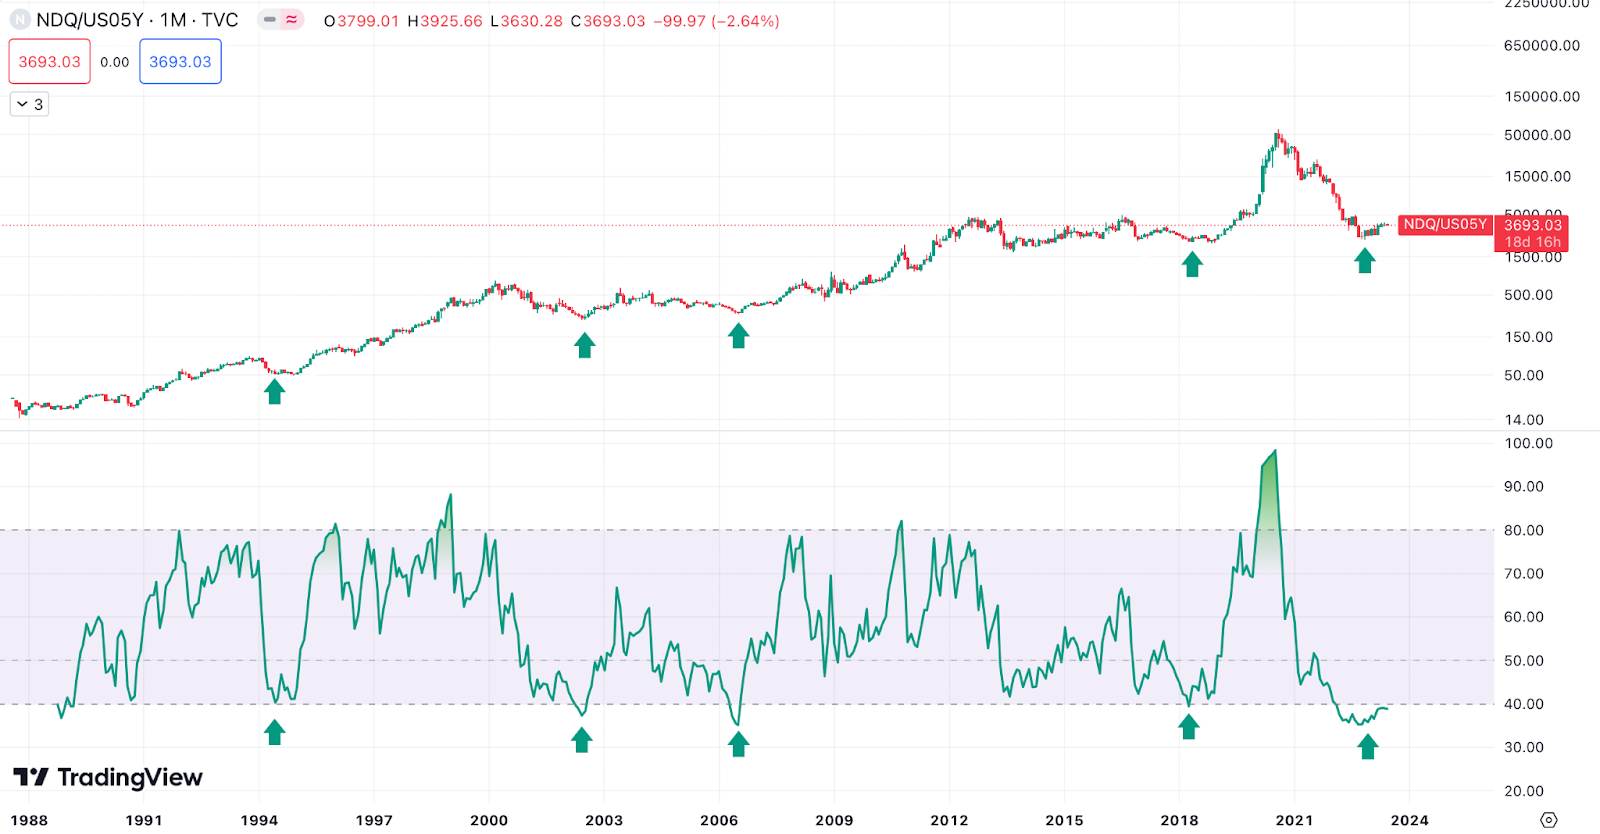
Where is the leading tech Index in the market cycle?
The Big Money either chases Bond yields or equity markets
Nasdaq against US 5 year bond yield is at the bottom of the cycle as seen on the chart. Whenever the RSI has been at or below 40 levels, historically the Big money starts chasing tech stocks leaving the bond market. The same is seen from last couple of weeks, the charts are indicating we are at the start of the bull cycle
The NASDAQ is expected to continue with its upward trajectory and the same is expected for the crypto markets as well. An immediate support is expected at 13,700 and next resistance is expected at 15,000 levels.
CRYPTO
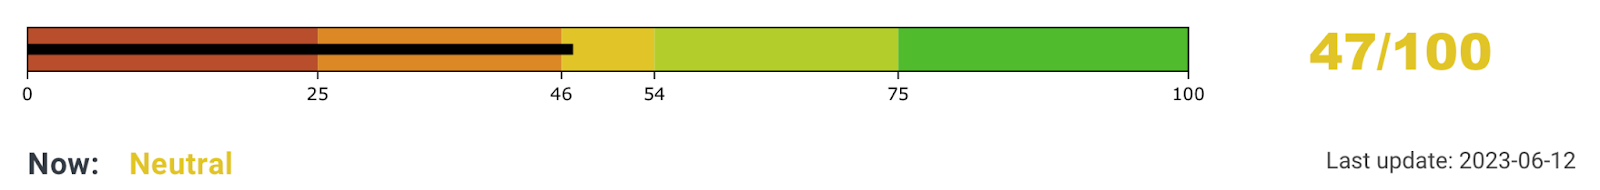
What is the general sentiment for Crypto?
The sentiment towards the cryptocurrency market remained in the NEUTRAL zone. Compared to last week, the Fear & Greed Index has decreased from “53” to “47”.
BITCOIN
SOPR – Another data to evaluate the sentiment of the general public would be to look at Spent Output Profit Ratio (SOPR). What is SOPR? In layman terms, it indicates if people have sold their BTC at a profit or if they sold at a loss. An SOPR value above 1 indicates that profit booking dominated loss booking and below 1 indicates that loss booking dominated profit booking. A value of 1 indicates that the coins were sold at their purchase price. Adjusted SOPR filters out transactions that are younger than 1 hour, thus, clearing out noise from the metric.
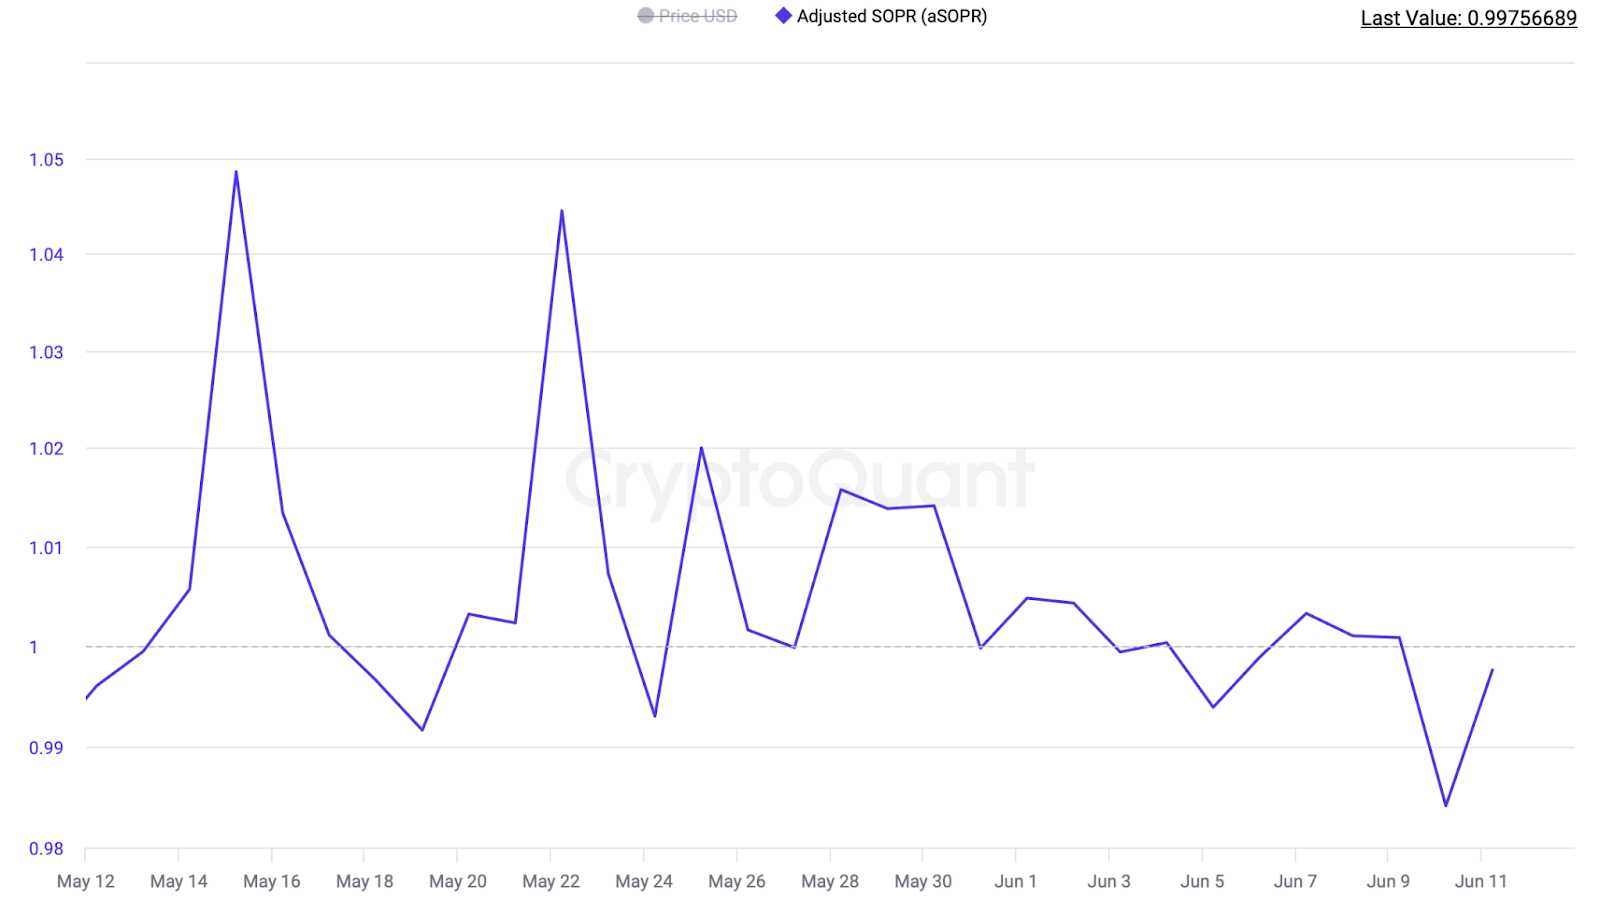
aSOPR for this week is below 1 which means investors are selling their Bitcoins at a loss.
Is This The Start of the Bull Market?
CVDD-TERMINAL PRICE CHART INDICATOR
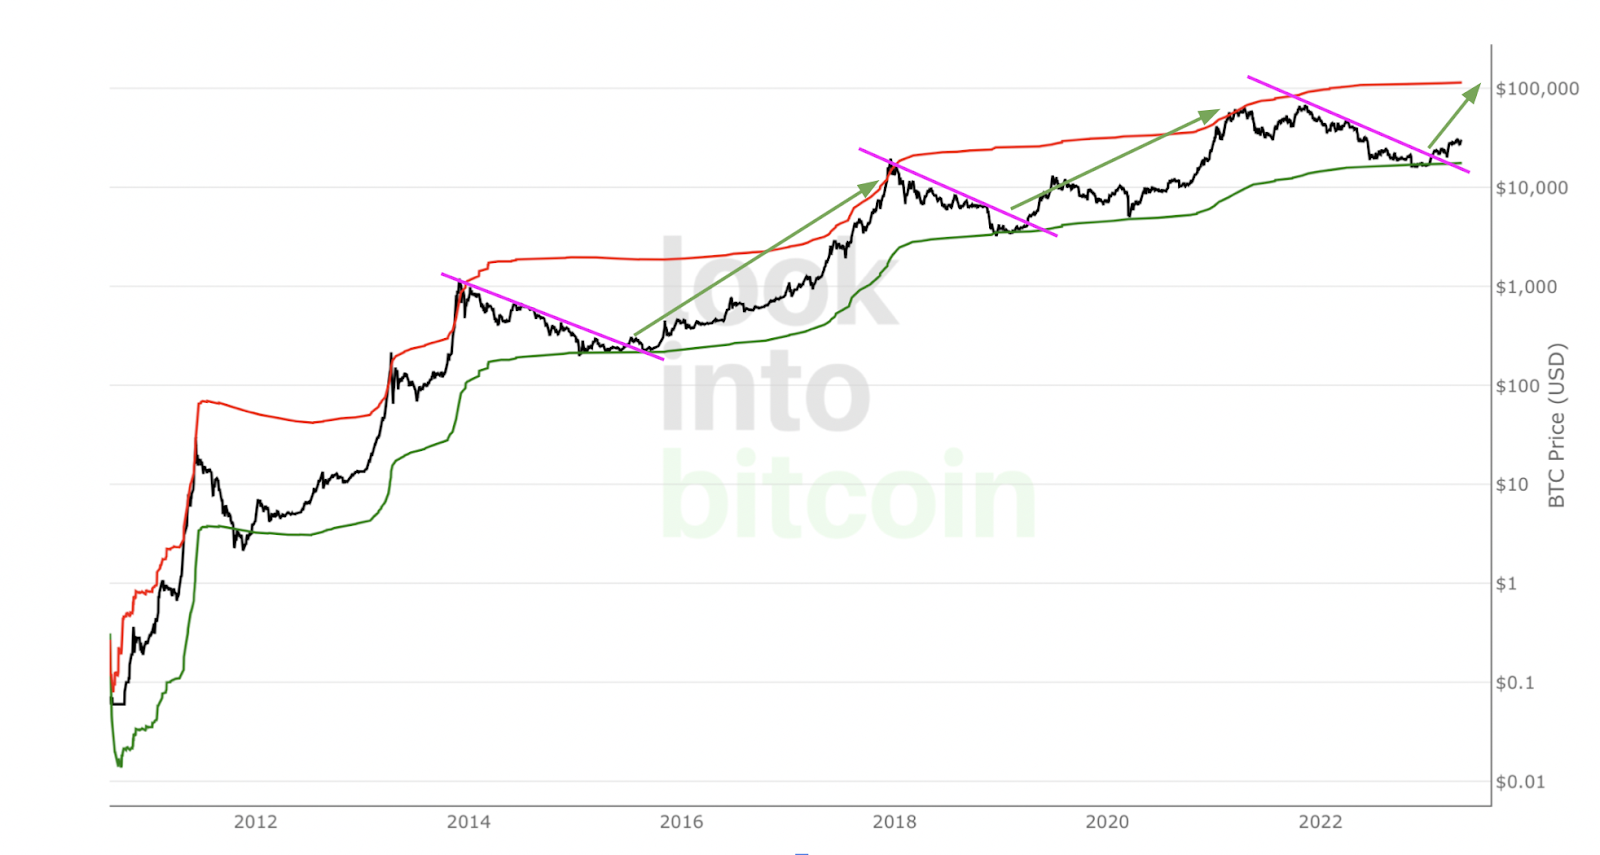
The Bitcoin price has broken out of the descending trendline. Bitcoin is expected to continue the upward movement.
Currently there are 156,299 addresses holding more than 10 BTC, it’s approaching an all time high
Bitcoin chart
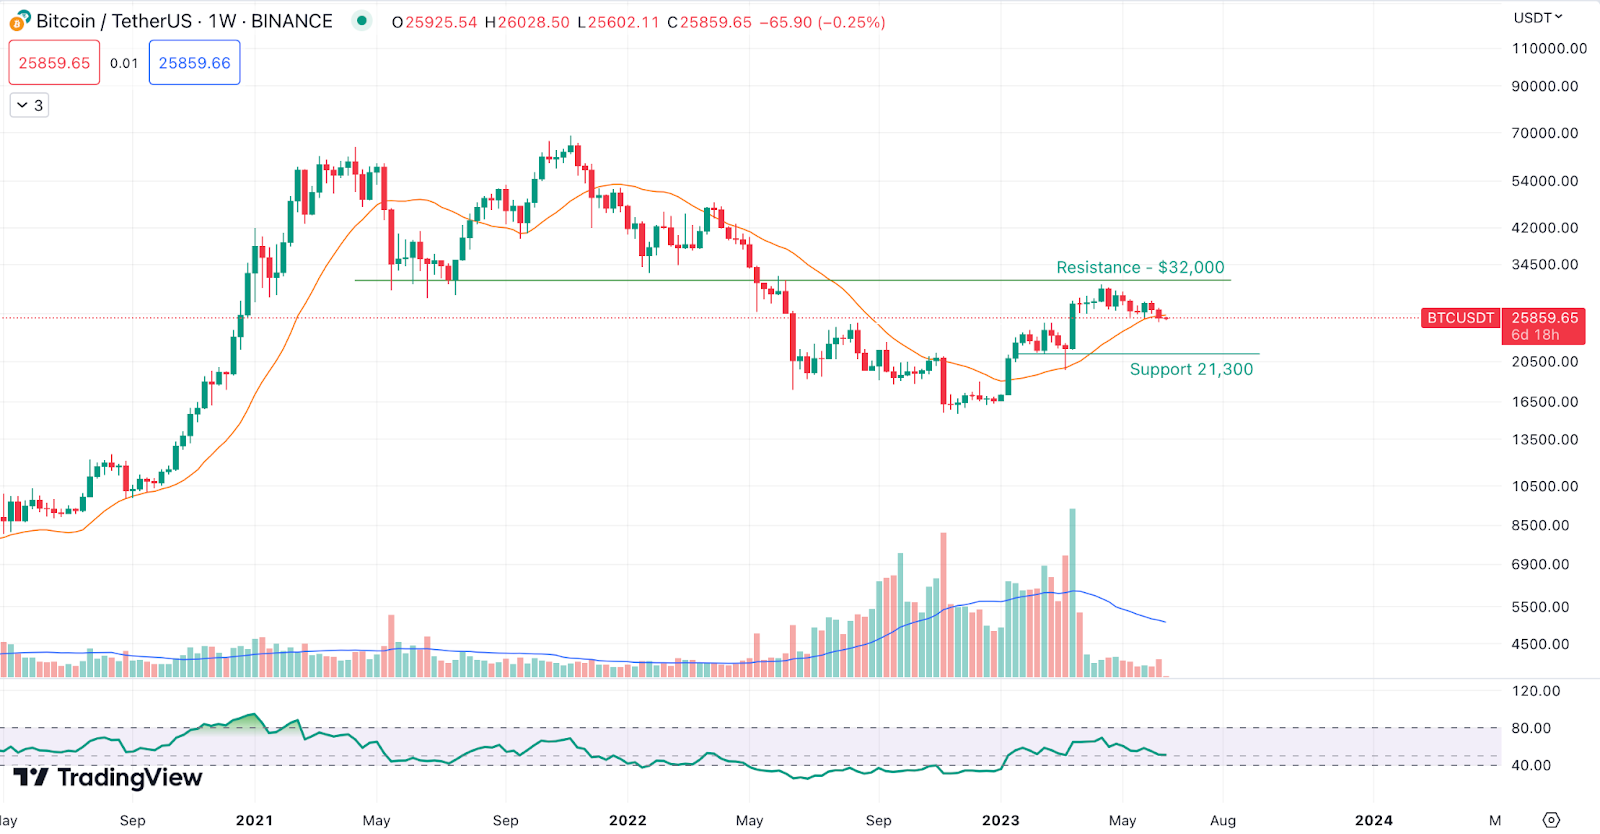
$BTC Price closed below the 20 week moving average. Sellers may take the charge and we could see price correction in BTC until it reclaims above 20 week moving average, the immediate support is expected at $21,300 and resistance is expected at $32,000.
ETH/BTC
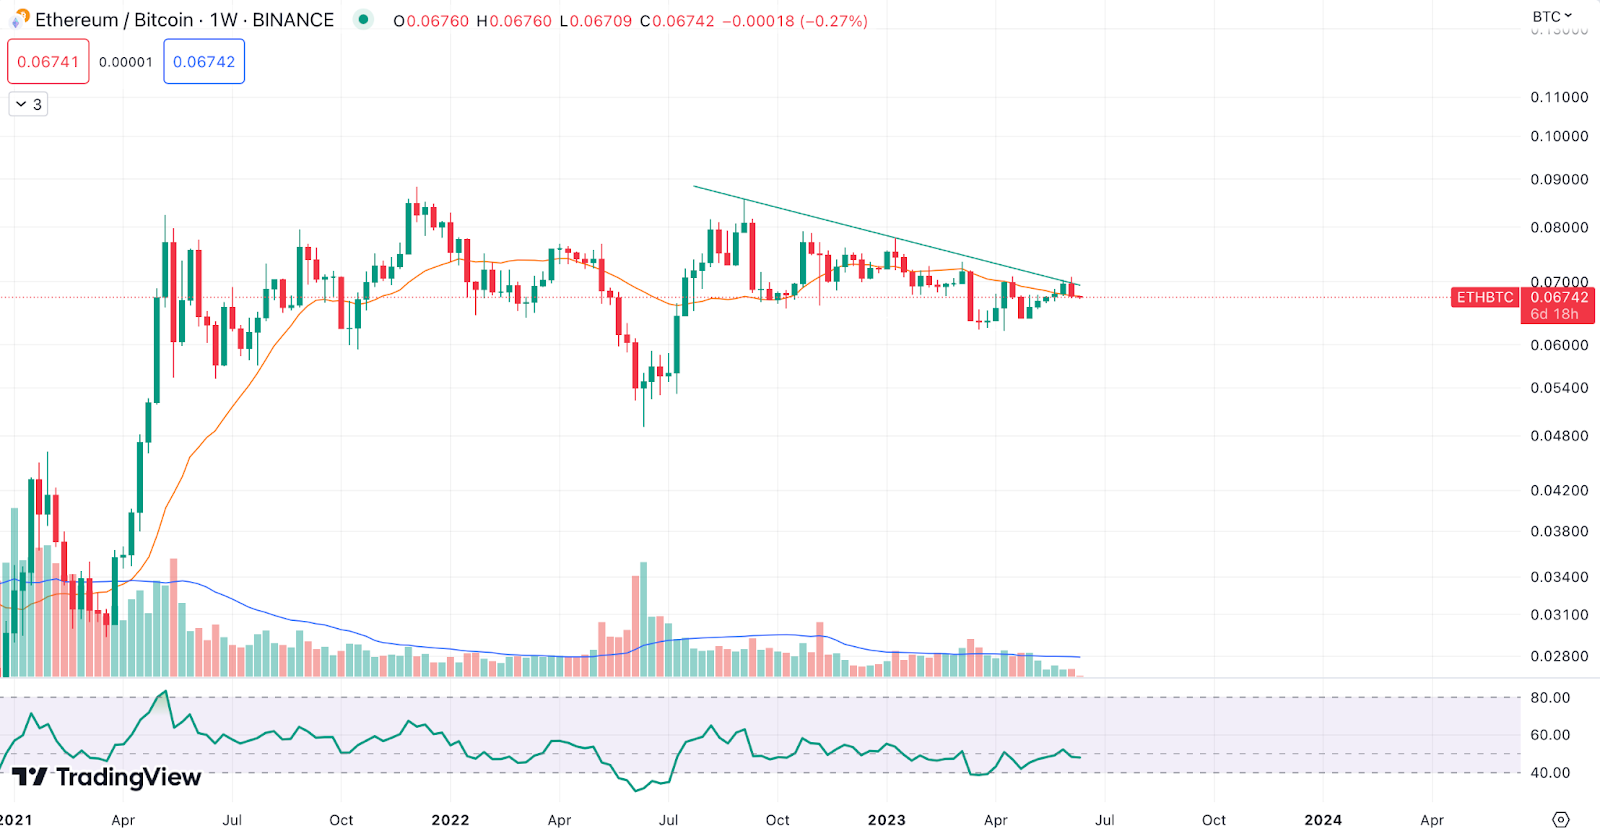
ETH/BTC is consolidating within the triangle pattern and it is trading above the 20 week moving average. It corrected by 3% against BTC in the last week, the immediate support is expected around 0.062 and the next resistance is expected around 0.073 level. ETH could outperform Bitcoin once it breaks out of the triangle pattern.
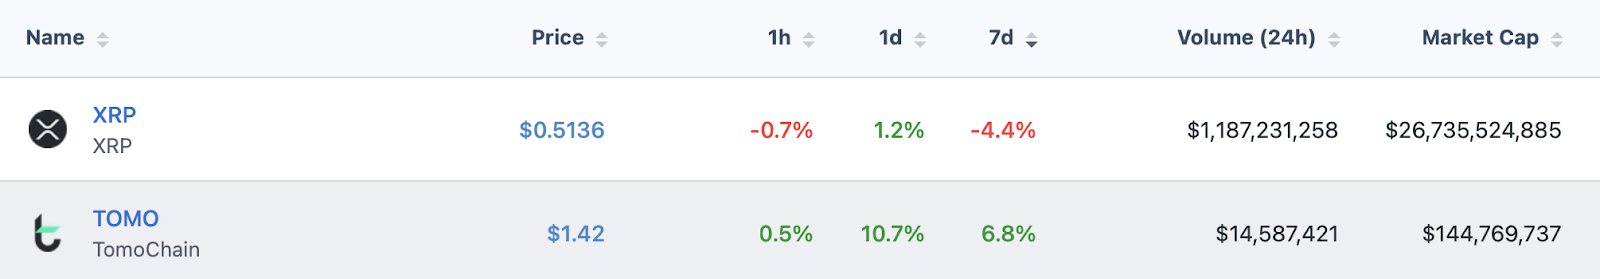
Tokens with Relative Strength in the market
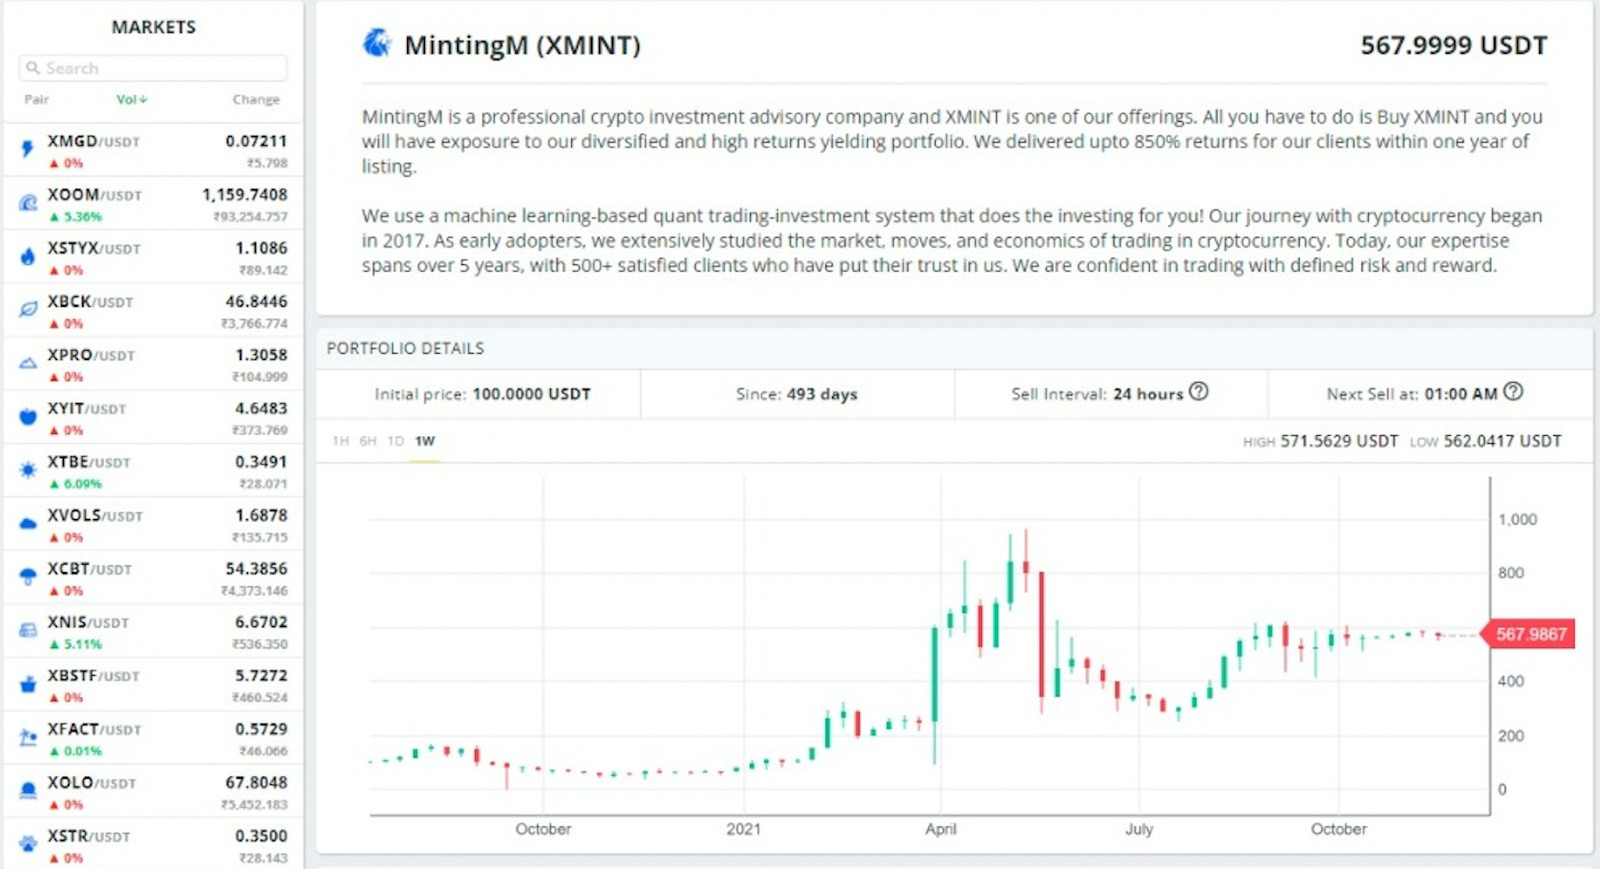
XMINT token listed on India’s biggest exchange delivered 10X returns.
Get deeper insights into the crypto market’s weekly trends discussed on our Spotify podcast.
Start your Crypto Investments with XMINT Algos today